
Peak 1
Peak 2
Peak 3
1
2
3
4
5
6
7
8
9
10
11
12
13
Time (min)
0
50
100
0
50
100
0
50
100
7.24
7.19
8.21 8.49
5.84
4.12
7.19
7.29
7.34
8.21 8.49
5.93
5.88
5.99
6.05
8.94
NL: 5.41E4
m/z= 226.60-227.60 F:
ITMS + c ESI d w Full
ms2
300.06@cid35.00
[70.00-315.00]
NL: 2.74E4
m/z= 226.60-227.60 F:
ITMS + c ESI d w Full
ms2
300.39@cid35.00
[70.00-315.00]
NL: 4.75E4
m/z= 175.60-176.60 F:
ITMS + c ESI d w Full
ms2
315.28@cid35.00
[75.00-330.00]
Peak
Number
Compound Name Code
SI
RSI
m/z
Expected
RT
Real RT Intensity
Library Name
1
Metoclopramide
p
958
958
300.20
7.20
7.24
54117
Tox_Library_LXQ
2
Metoclopramide
p
984
984
300.20
7.20
7.19
27361
Tox_Library_LXQ
3
Ranitidine
p
792
802
315.20
5.45
5.93
47525
Tox_Library_LXQ
Acquired Spectrum
100 150 200 250 300
m/z
0
10
20
30
40
50
60
70
80
90
100
RelativeAbundance
176.05
124.04
270.15
224.14
144.13 191.22
102.13
225.10 271.31
Delta Spectrum
Rawdata - Libraryentry
330
100 150 200 250
m/z
100
-100
0
RelativeAbundance
124
225
170
102
271
Library Spectrum
100 150 200 250 300
m/z
0
10
20
30
40
50
60
70
80
90
100
RelativeAbundance
176
124
270
224
144
191
102
241
95
284
Library Structure
Acquired Spectrum
100 150 200 250 300
m/z
0
10
20
30
40
50
60
70
80
90
100
Relative Abundance
227.04
184.10 227.78
112.01
Delta Spectrum
Rawdata - Libraryentry
315
100 150 200 250
m/z
100
-100
0
Relative Abundance
184 215
Library Spectrum
100 150 200 250 300
m/z
0
10
20
30
40
50
60
70
80
90
100
Relative Abundance
227
184
228
Library Structure
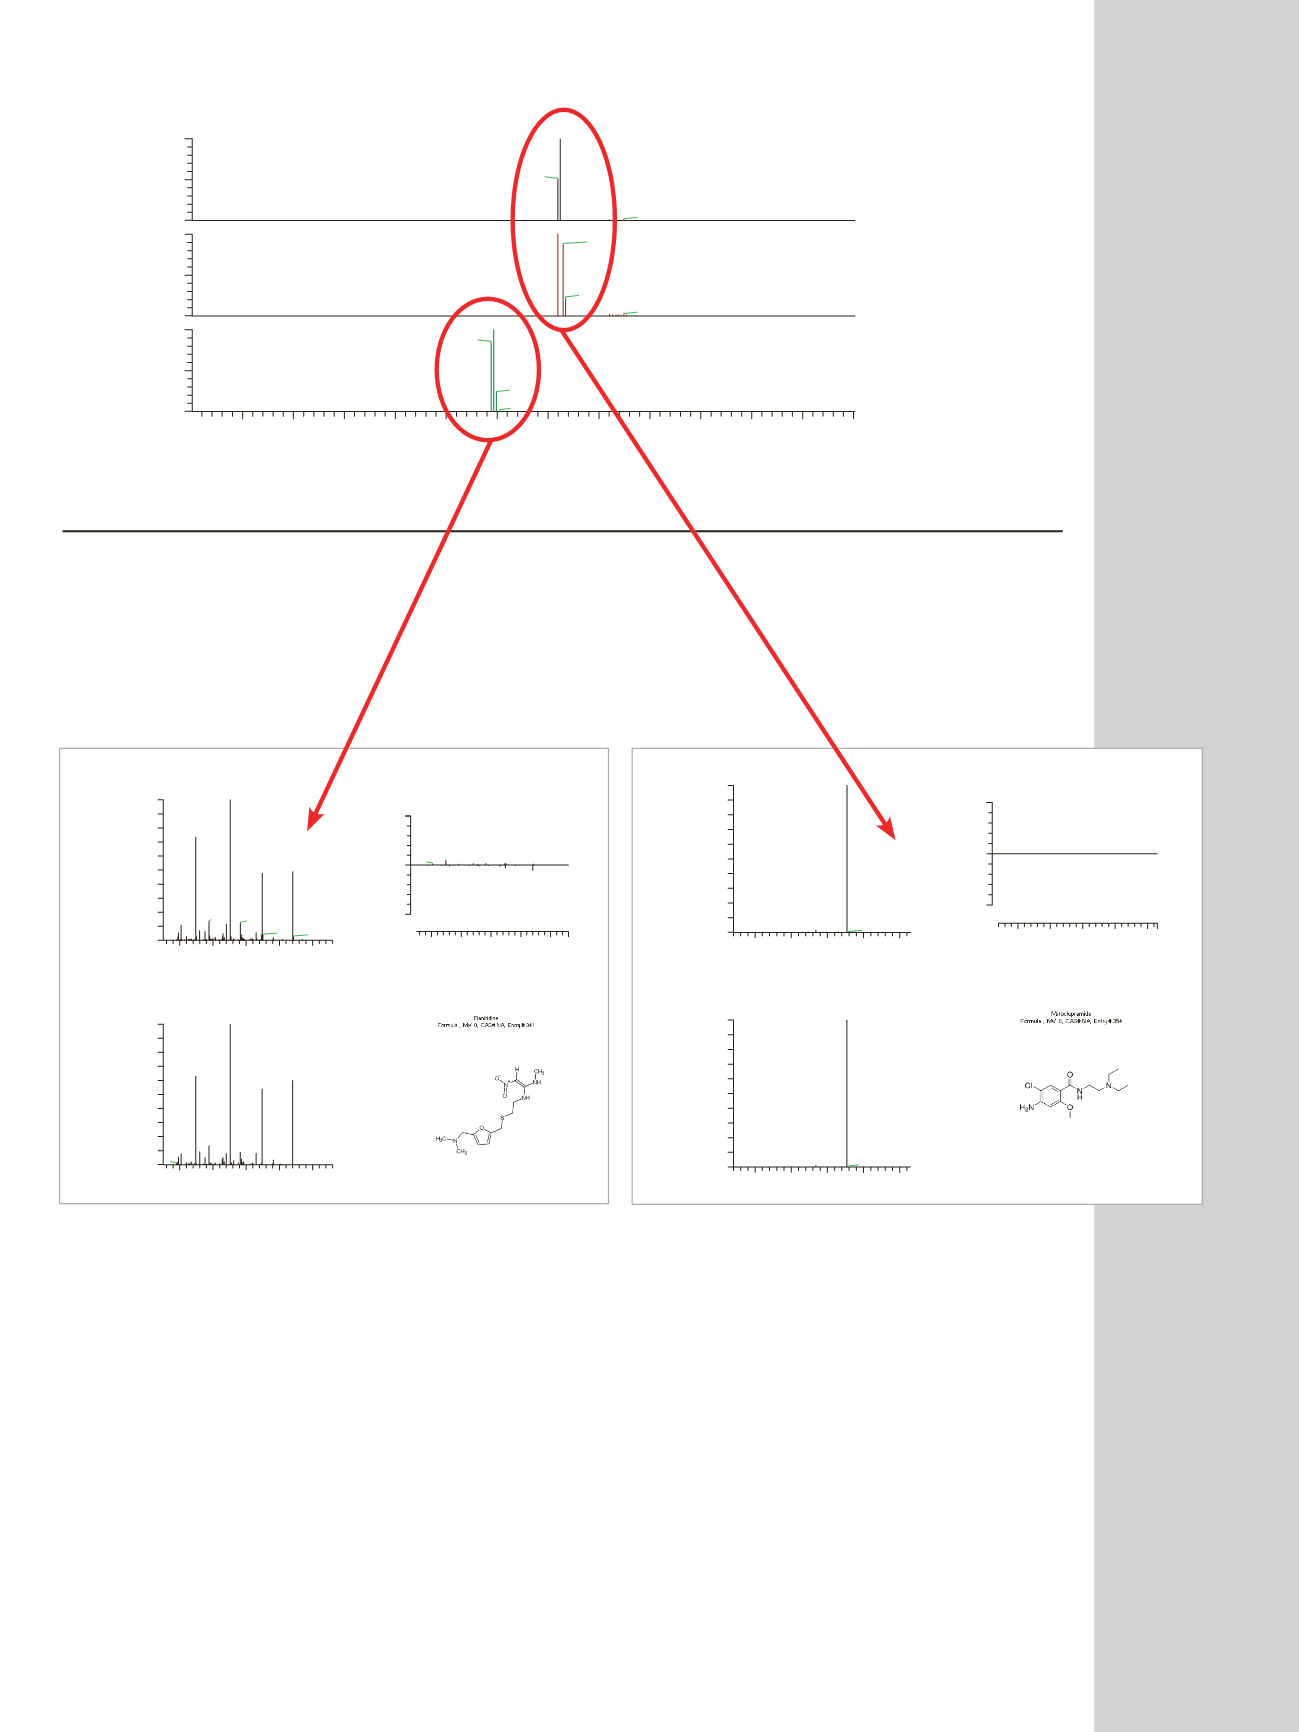
Figure 2. ToxID software long report showing ion chromatograms and MS/MS spectra of compounds detected in Urine 5. Mass spectra recorded for ranitidine
and metoclopramide show a perfect match when compared with spectra from the database.


