
Company Name
ToxID Summary Report
ettings\marta.kozak\Desktop\Desktop\Application_Notes\ToxID\2J.RAW
ples\ToxID\ToxID_config_13min.csv
4:54 AM
4
6
8
10
12
Time (min)
5.06
5.12
5.18 5.91
6.76
6.82
6.86
6.69
6.96
6.63
7.55
3.93 5.13
4.83 4.89
4.78 4.95 6.86 7.61
7
6.83
6.87
6.71 6.91
7.35
6.82 6.82
6.76 6.90
7.01
6.70
7.51
5.56
5.61
5.68 6.97
5.18
6.26
6.20
6.32
6.16 6.38 7.18
5.45
5.40
5.51
6.28
NL: 1.49E5
m/z= 183.8-184.2 F: ITMS + c ESI
d w Full ms2
240.00@cid35.00
[55.00-250.00]
NL: 9.55E3
m/z= 249.0-249.4 F: ITMS + c ESI
d w Full ms2
278.25@cid35.00
[65.00-290.00]
NL: 1.30E4
m/z= 215.0-215.4 F: ITMS + c ESI
d w Full ms2
278.25@cid35.00
[65.00-290.00]
NL: 4.23E4
m/z= 264.9-265.3 F: ITMS + c ESI
d w Full ms2
310.15@cid35.00
[75.00-325.00]
NL: 2.92E3
m/z= 273.9-274.3 F: ITMS + c ESI
d w Full ms2
322.20@cid35.00
[75.00-335.00]
NL: 1.55E5
m/z= 276.0-276.4 F: ITMS + c ESI
d w Full ms2
330.20@cid35.00
[80.00-345.00]
NL: 8.56E4
m/z= 168.9-169.3 F: ITMS + c ESI
d w Full ms2
380.40@cid35.00
[90.00-395.00]
NL: 3.95E4
m/z= 253.0-253.4 F: ITMS + c ESI
d w Full ms2
384.25@cid35.00
[95.00-395.00]
ode SI
RSI
m/z Expected
RT
Real RT Intensity Library Name
Page 1 of 1
p
909
909
240.0
5.20
5.06
148721
Tox_Library
p
857
873
278.2
6.60
6.76
9549
Tox_Library
p
816
837
278.2
4.90
4.83
12964
Tox_Library
p
932
932
310.2
6.70
6.83
42262
Tox_Library
i
859
859
322.2
6.80
6.82
2924
Tox_Library
i
969
974
330.2
5.60
5.56
154827
Tox_Library
i
830
837
380.4
6.20
6.26
85589
Tox_Library
p
870
871
384.2
5.40
5.45
39512
Tox_Library
port is designed for a quick synopsis of the data.
Company Name ToxID Long Report
Raw File Name: C:\Documents and Settings\marta.kozak\Desktop\Desktop\Application_Notes\ToxID\2J.RAW
Config File Name: C:\Xcalibur\examples\ToxID\ToxID_config_13min.csv
Sample Name:
Laboratory: ChemLab
Acquistion Start Time: 2/13/2007 1:04:54 AM
Peak
Number
Compound Name
Code
SI
RSI
m/z Expected
RT
Real RT Intensity
Library Name
Page 3 of 8
3 Venlafaxine
p
816
837
278.2
4.90
4.83
12964
Tox_Library
Peak 3
1
2
3
4
5
6
7
8
9
10
11
12
13
Time (min)
0
20
40
60
80
100
RelativeAbundance
4.83
4.89
4.78
4.95
6.86
5.13
7.61
6.15
2.97 3.22
NL: 1.30E4
m/z= 215.0-215.4
F: ITMS+ cESI dw
Fullms2
278.25@cid35.00
[65.00-290.00]
Acquired Spectrum
100
150
200
250
m/z
0
10
20
30
40
50
60
70
80
90
100
RelativeAbundance
215
121
147
159
243
173
86 100 135
Delta Spectrum
Raw data - Libraryentry
290
100 150 200 250
m/z
100
-100
0
RelativeAbundance
121
243
86
152
205
Library Spectrum
100
150
200
250
m/z
0
10
20
30
40
50
60
70
80
90
100
RelativeAbundance
215
121
147
159
217
178
233
91
Library Structure
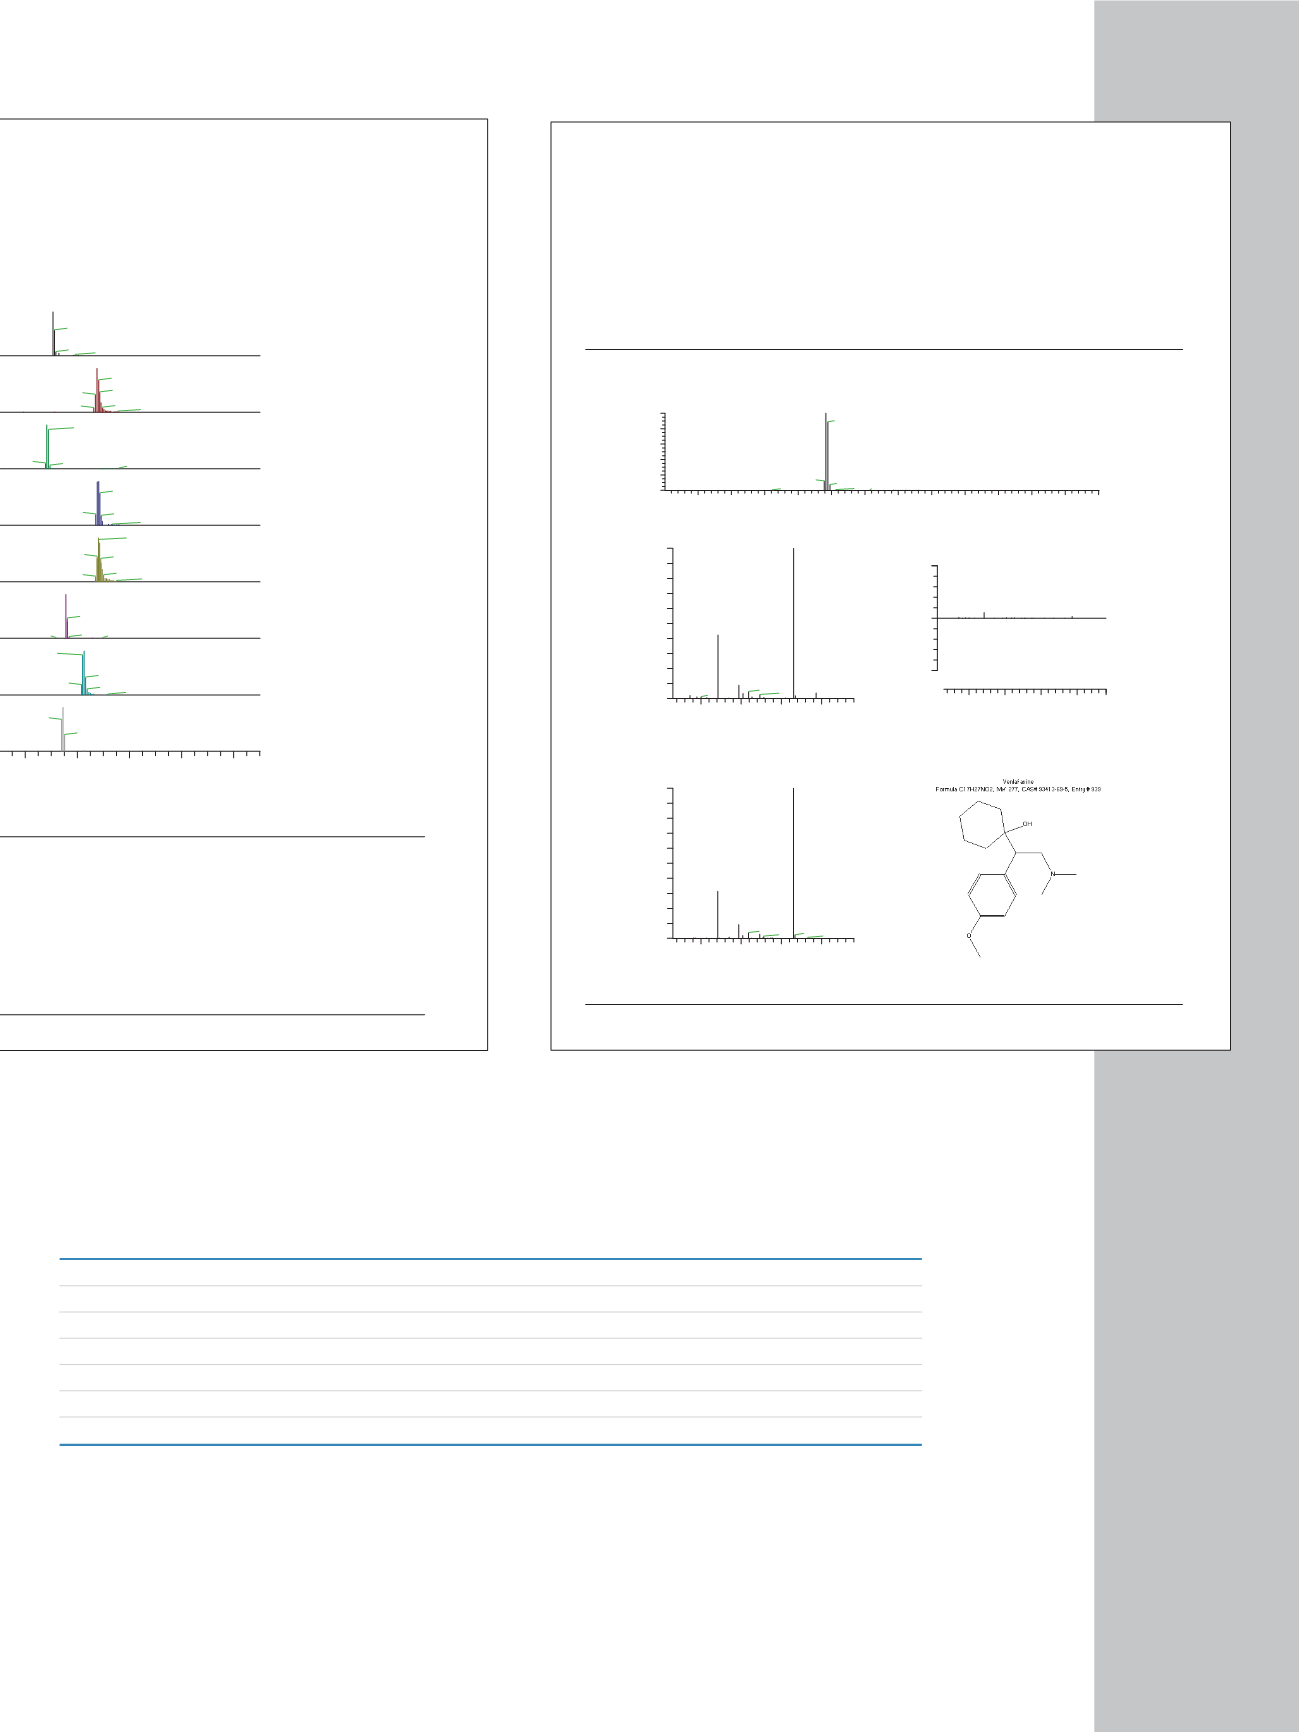
Figure 4: The ToxID Long Report is designed for a more thorough examination of
the data.
STEP 1: Directly infuse analyte to obtain MS
2
spectra, then add spectra to the library
10 Minutes
STEP 2: Run analyte on column to obtain retention times
13 Minutes
STEP 3: Update Parent Mass Table in instrument method with parent masses and retention times
2 Minutes
STEP 4: Update ToxID with name, parent masses, the most intense product ion and retention times 2 Minutes
Table 5. Simple workflow for adding new analytes


