
Results and Discussion
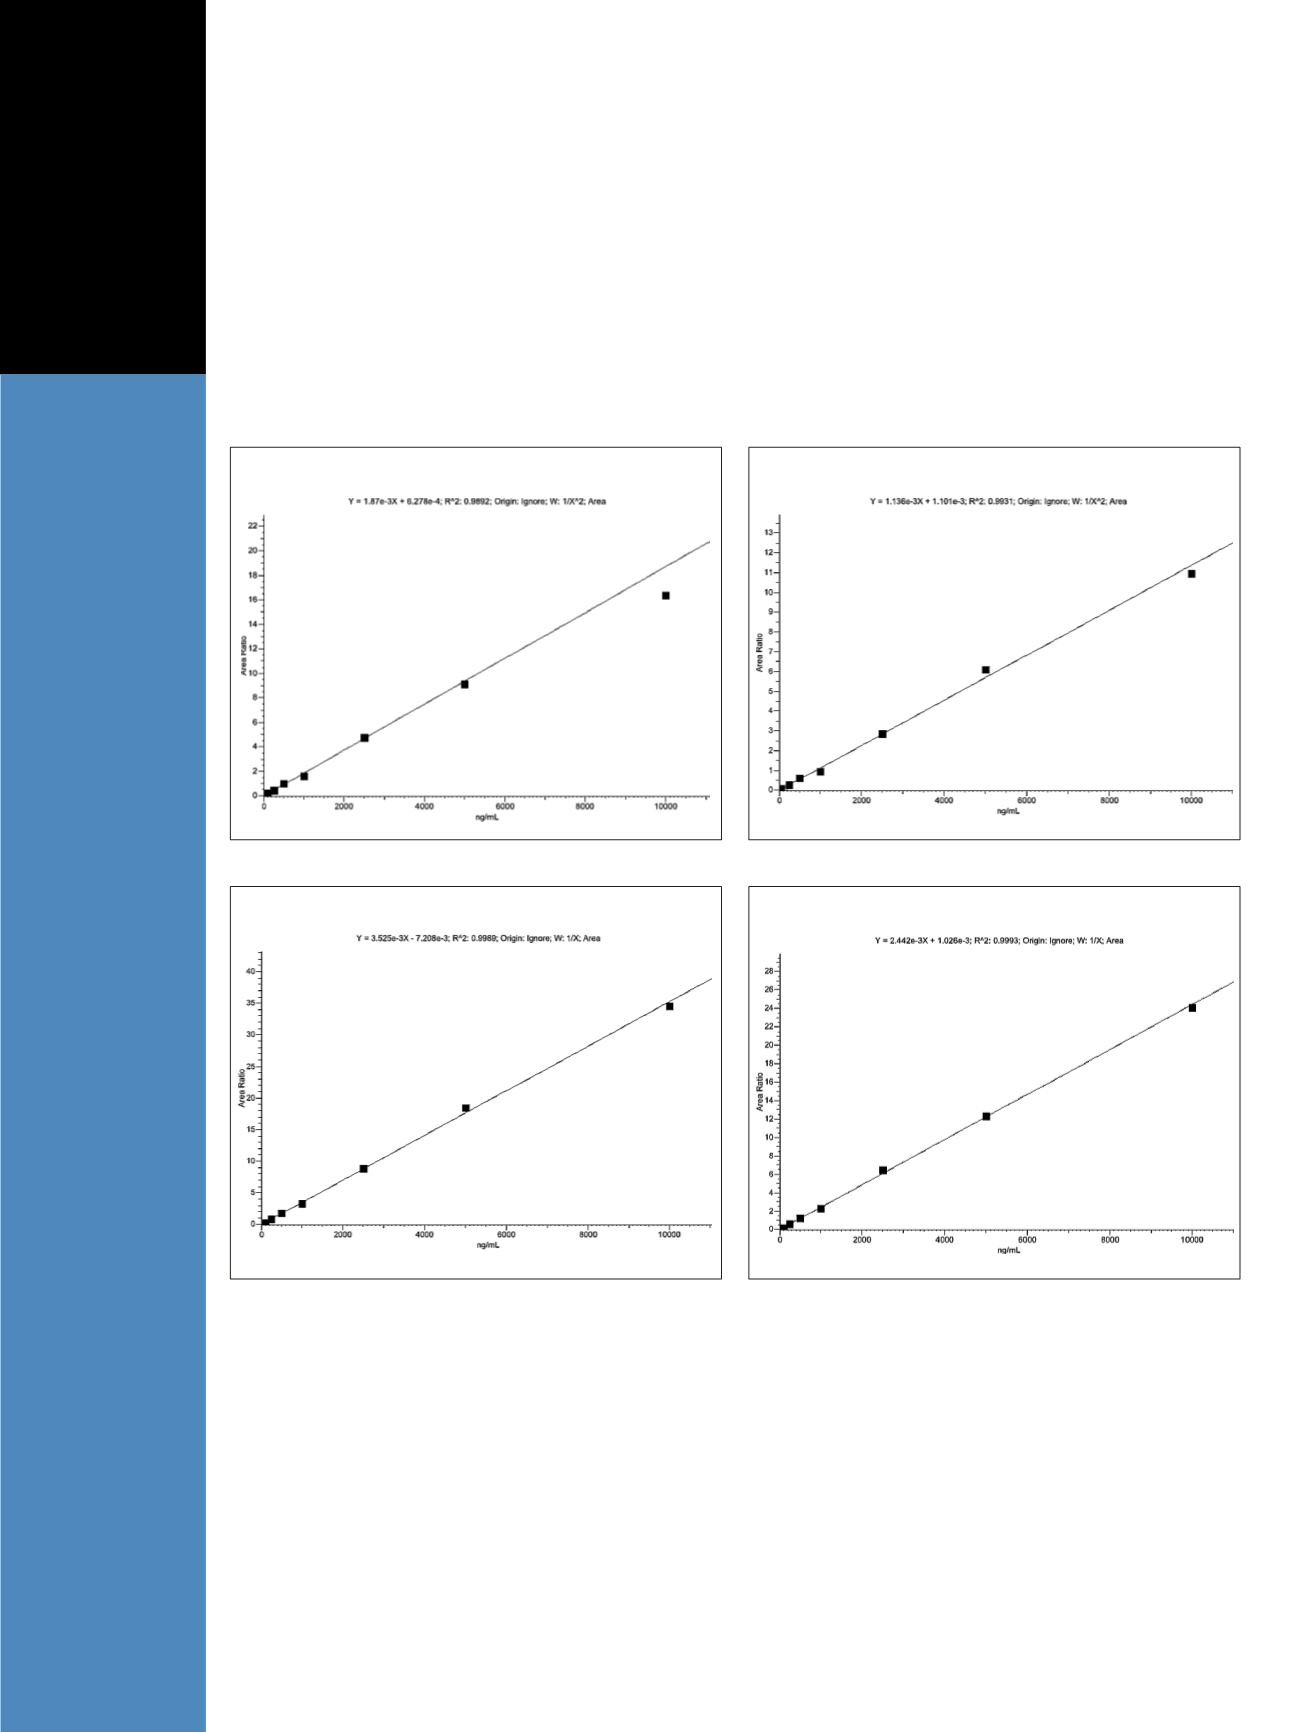
The method is linear from 25 to 10,000 ng/mL with
R
2
values > 0.99 for all 14 compounds (Figure 1). All
calibrators back calculate to within 15% of nominal
(20% for LOQ). All quality controls quantitated to within
15% of nominal for the middle and high controls and
within 20% for the low control. The %CV was less than
10% for all QC levels.
Figure 1. Representative calibration curves for some benzodiazepines showing linearity from 25-10,000 ng/mL in urine
No matrix effects were observed during validation.
All samples showed recoveries within 20% of nominal.
Table 1 shows the matrix effect results.
Figure 2 shows an SRM chromatogram at LOQ.
2-hydroxyethylflurazepam
a
-hydroxytriazolam
7-aminotriazepam
Diazepam


