
Targeted Screening of Drugs of Abuse and
Toxic Compounds with LC-MS/MS Using
Triple Stage Quadrupole Technology
C. Gechtman, A. Masarin, A.O. Ospedale Niguarda Cà Granda, Milano, Italy
S. Scurati, Thermo Fisher Scientific, Milano, Italy
B. Duretz, P. Regulus, Thermo Fisher Scientific, Courtaboeuf, France
For Forensic Toxicology Use Only.
Application
Note: 536
Key Words
• TSQ Quantum
Access MAX
• TraceFinder
Software
• QED
• Forensic
Toxicology
Introduction
Screening of biological samples for drugs of abuse and
other toxic compounds is one of the main issues in forensic
toxicology. The challenge is to provide rapid and accurate
results despite the large number of targeted molecules and
the complexity of biological matrices.
Here we present the workflow and results obtained by
using a liquid chromatography-tandem mass spectrometry
(LC-MS/MS) timed selected reaction monitoring (T-SRM)
method utilizing a triple stage quadrupole mass
spectrometer. In a T-SRM experiment, the method is set
to look for specific transitions only during the expected
retention-time window. This increases the number of SRM
transitions that can be monitored in a single experiment. It
also increases the dwell time and duty cycle for monitoring
individual compounds per experiment. Then, quantitation-
enhanced data dependent (QED) MS/MS scan functions
are used to trigger data dependent full scan MS/MS spectra
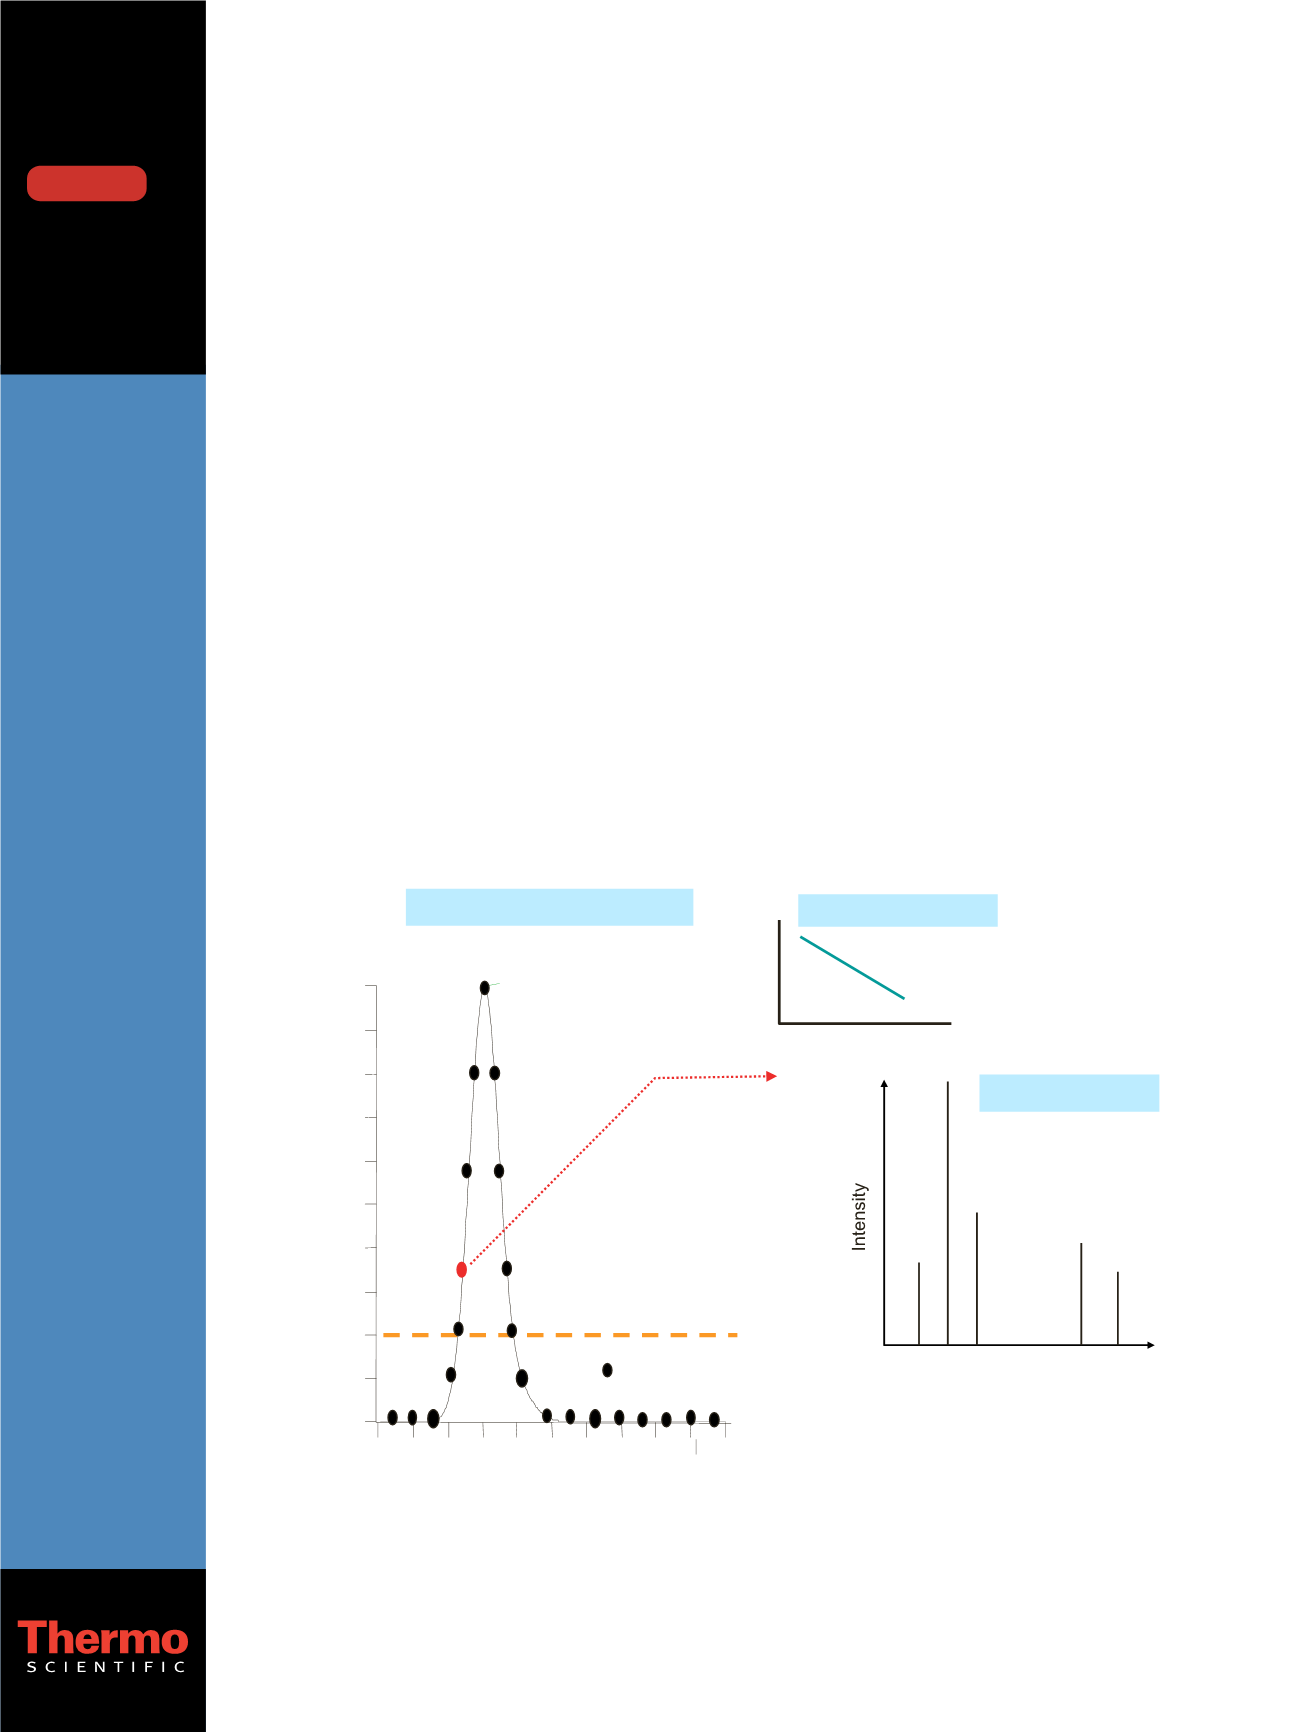
from SRM transitions. When a particular SRM transition
reaches a predefined intensity threshold, the instrument
automatically triggers QED-MS/MS, using the reverse
energy ramp (RER) scan function to increase the product
ion sensitivity (Figure 1). Dynamic exclusion settings
allow the maximum number of MS/MS collected for each
compound to be specified, thus giving the ability to collect
MS
2
spectra of coeluting molecules.
Goal
To evaluate a triple stage quadrupole mass spectrometer
for targeted screening in human urine utilizing a
LC-QED-MS/MS method for forensic toxicology
laboratories. This screening technique is asked to be fast
and reliable enabling high throughput screening.
0
10
20
30
40
50
60
70
80
90
100
Relative Abundance
9.8 10.0 10.2 10.4 10.6
min
RT:10.0
SRM chromatogram
m/z
SRM data point
MS/MS spectrum
Reverse Energy Ramp
Collision Energy Q2
m/z
Q3
Figure 1: QED detection mode: when a monitored SRM transition reaches a targeted threshold, a full MS
2
spectrum is
acquired using a Reverse Energy Ramp scan.
DOWNLOAD


