
Experimental Conditions
Sample Preparation
Urine was stored at -20 °C; for the analysis. After
thawing, the urine was diluted 10 times with water. For
the analysis, 10 µL of urine was directly injected into the
LC-MS/MS.
Chromatography and Mass Spectrometry
A Thermo Scientific Hypersil GOLD PFP analytical col-
umn (50 x 2.1 mm, 5 µm) was used for separation of the
compounds. A 15-minute gradient was set up using
10 mM ammonium formate and 0.1% formic acid in
water for the mobile phase A and acetonitrile containing
0.1% formic acid for the mobile phase B.
The mass spectrometer was a Thermo Scientific TSQ
Quantum Access MAX triple stage quadrupole with
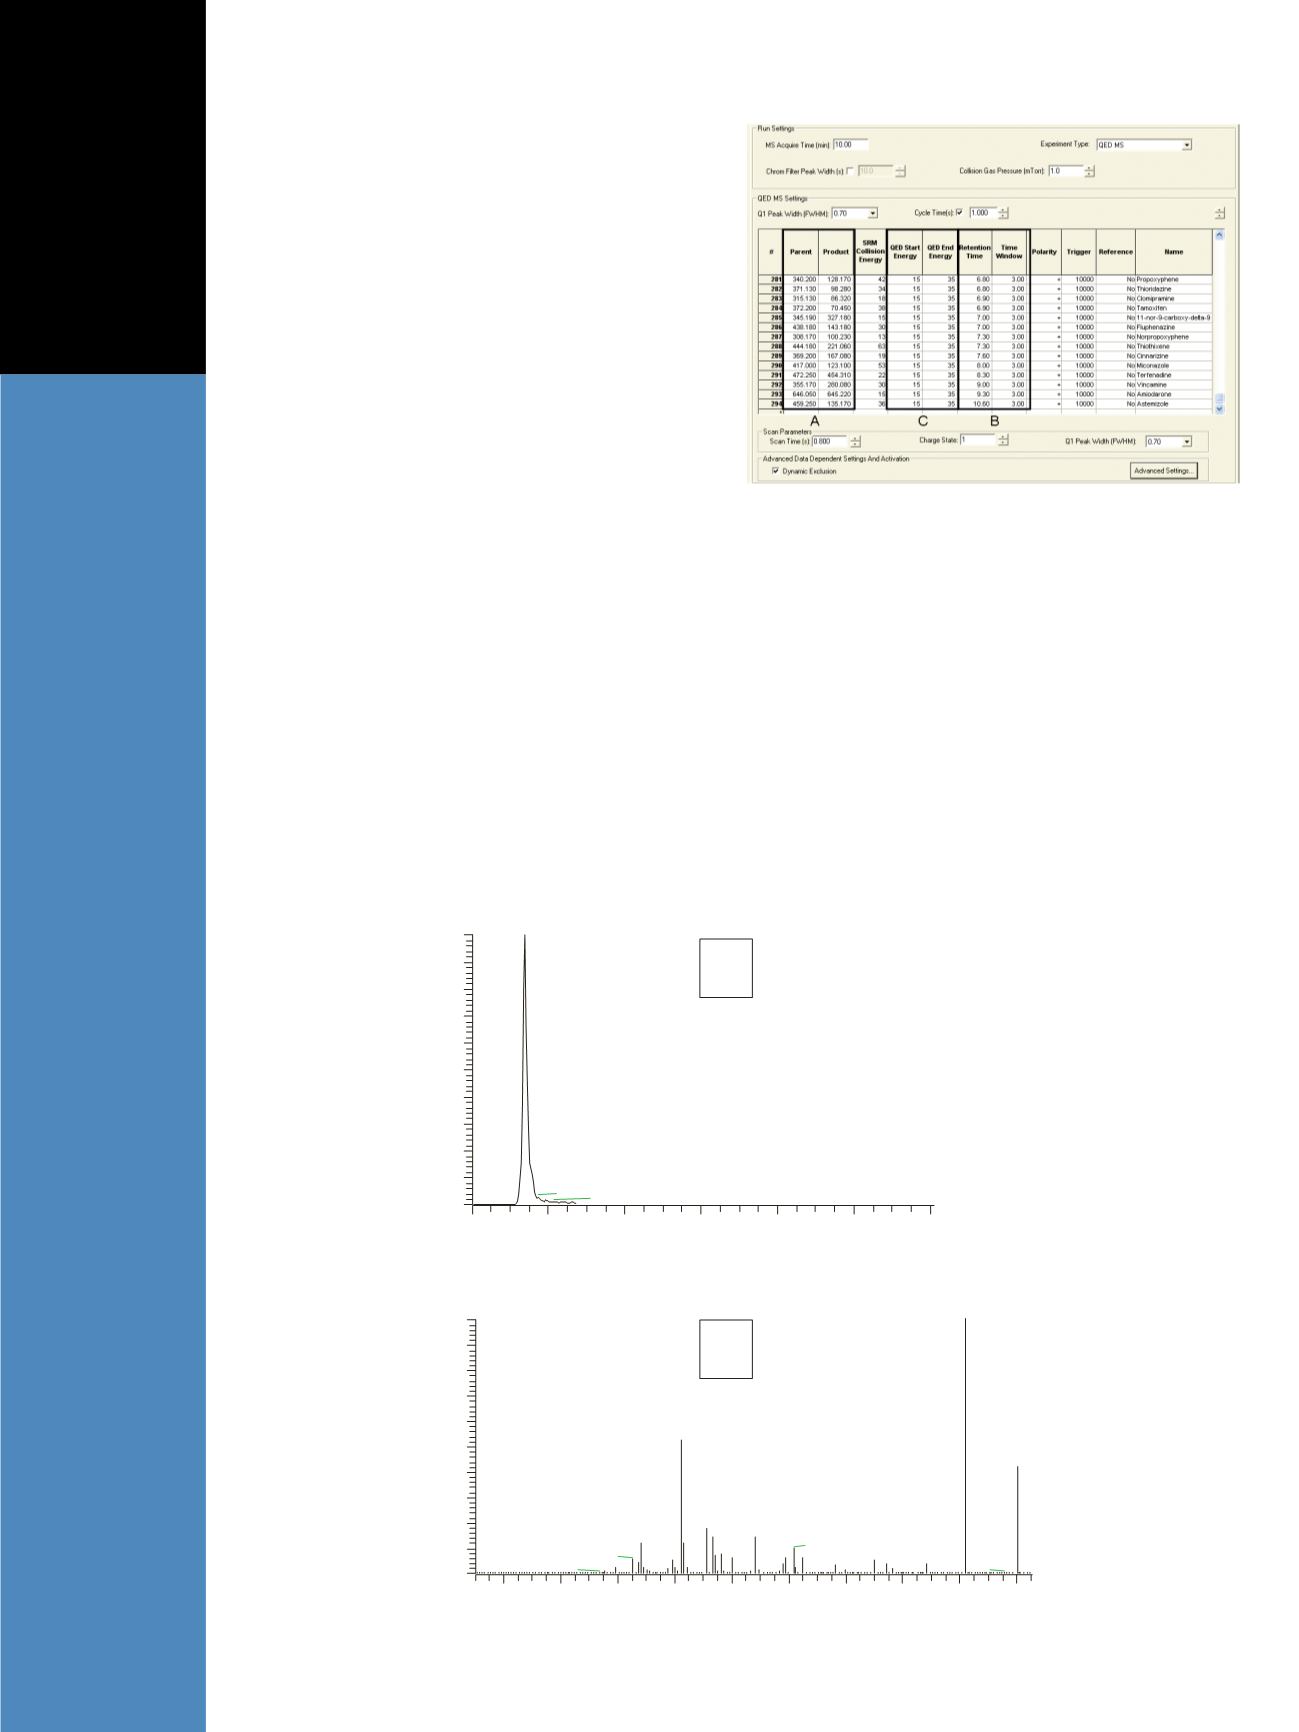
an Ion Max ion source. The instrument acquired SRM
(Figure 2A) transitions of 294 compounds (drugs, toxic
compounds, and metabolites) using T-SRM (Figure 2B).
When an SRM transition reached 10,000 counts, QED
detection was activated to collect full MS/MS spectra
applying a ramp of collision energy from 15 to 35 eV
(Figure 2C).
Data generated were processed with Thermo Scientific
TraceFinder software for automated target screening.
TraceFinder™ software can identify compounds based
on their respective retention time, SRM transition, and
full MS/MS spectra. The library contains 294 spectra of
toxic and illicit compounds, and the corresponding SRM
transitions are reported in the method.
Results and Discussion
The analysis time was 15 minutes. Figure 3A shows an
example of an ion chromatogram of one of the monitored
SRMs. Using QED-RER, the corresponding full MS
2
was
recorded also (Figure 3B).
Figure 2: Method parameters used for LC-MS/MS screening of 294 compounds
Panel A: SRM transitions monitored
Panel B: Time segment used for Timed SRM
Panel C: When QED is activated an energy ramp from 15 to 35 eV is
applied
A
RT:
0.00 - 12.09
0
2
4
6
8
10
12
Time (min)
0
10
20
30
40
50
60
70
80
90
100
Relative Abundance
1.40
1.72 2.15
0.60
NL: 6.97E6
TIC F: + c ESI
SRM ms2 200.200
[182.099-182.101]
MS
F:
+ c ESI d Full ms2 200.200 [10.000-205.200]
20
40
60
80 100 120 140 160 180 200
m/z
0
10
20
30
40
50
60
70
80
90
100
Relative Abundance
182.07
82.18
200.14
91.14 108.19
68.29
121.85
65.26
150.12 168.17
53.54
195.54
31.23
B
Figure 3: Example of ion chromatogram of transition 200
→
182 (A) and corresponding full MS
2
spectra
collected (B)


