
3
EtG RT: 2.17/25 ng
85000
80000
75000
70000
65000
60000
55000
50000
45000
40000
35000
30000
25000
20000
15000
10000
5000
0
1.95 2.00 2.05 2.10 2.15 2.20 2.25 2.30 2.35 2.40
Relative Intensity
850
90000
EtG RT: 1.51/50 ng
800
750
700
650
600
550
500
450
400
350
300
250
200
150
100
50
0
Relative Intensity
RT (min)
1.30 1.35 1.40 1.45 1.50 1.55 1.60 1.65 1.70 1.75
RT (min)
1300
0
1200
1100
1000
900
800
700
600
500
400
300
200
100
Relative Intensity
30000
RT: 1.51/50 ng
RT: 2.17/25 ng
0
28000
26000
24000
22000
20000
18000
16000
14000
12000
10000
8000
6000
4000
2000
Relative Intensity
1.30 1.35 1.40 1.45 1.50 1.55 1.60 1.65 1.70 1.75
RT (min)
1.95 2.00 2.05 2.10 2.15 2.20 2.25 2.30 2.35 2.40
RT (min)
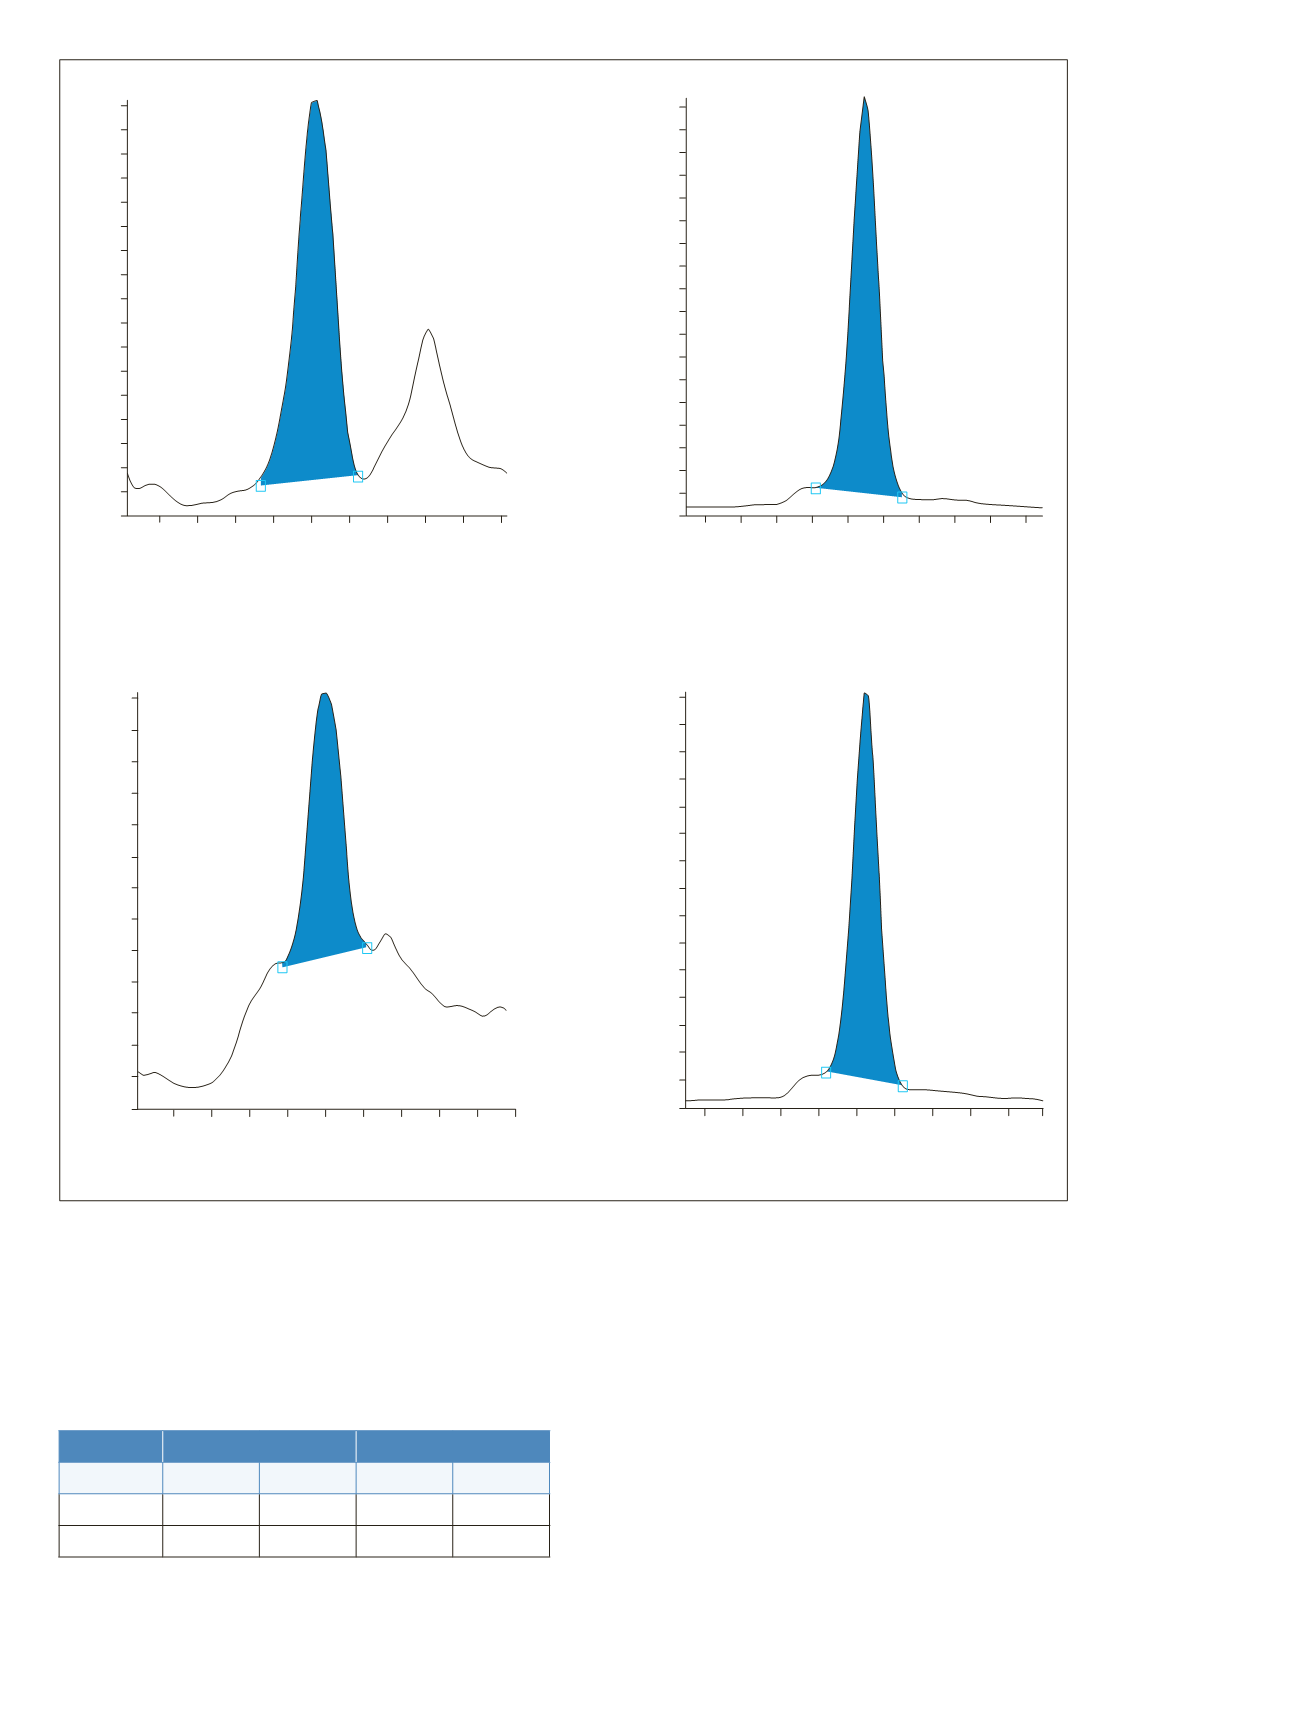
(a) EtG quantifier ion at 50 ng/mL
(b) EtS quantifier ion at 25 ng/mL
(c) EtG confirming ion at 50 ng/mL
(d) EtS confirming ion at 25 ng/mL
Figure 3. Representative chromatograms showing quantifier (a and b) and confirming (c and d) ions for EtG and
EtS at 50 and 25 ng/mL, respectively
50 ng/mL
100 ng/mL
%Bias
%RSD %Bias
%RSD
EtG
-0.253 12.0
3.31
6.94
EtS
-1.04
8.80
-1.99
5.67
Table 2 shows the inter-assay precision and accuracy for
EtG and EtS at 50 and 100 ng/mL.
Table 2. Inter-assay precision and accuracy for quality controls of
EtG and EtS


