
2
Two selected-reaction monitoring (SRM) transitions were
monitored for EtG, EtS and their deuterated internal
standards to provide ion ratio confirmations (IRC). The
scans were run in timed selected-reaction monitoring
(t-SRM) mode with a cycle time of 0.25 seconds. In this
mode, SRM transitions are given a retention time and
window in which the mass spectrometer acquires the
specified transitions only. This allows the instrument to
maximize the amount of time spent acquiring each
transition, while maintaining a consistent number of
data points across the chromatographic peak.
Data was acquired and processed with
Thermo Scientific ™ TraceFinder ™ software.Validation
Intra-assay precision and accuracy were determined by
analyzing a calibration curve along with six replicates of
quality control (QC) samples. Inter-assay precision and
accuracy were determined by analyzing a calibration
curve along with six replicates of QC samples on three
different days. Matrix effects were evaluated by observing
the internal standard signals in 23 different lots of human
urine.
Results
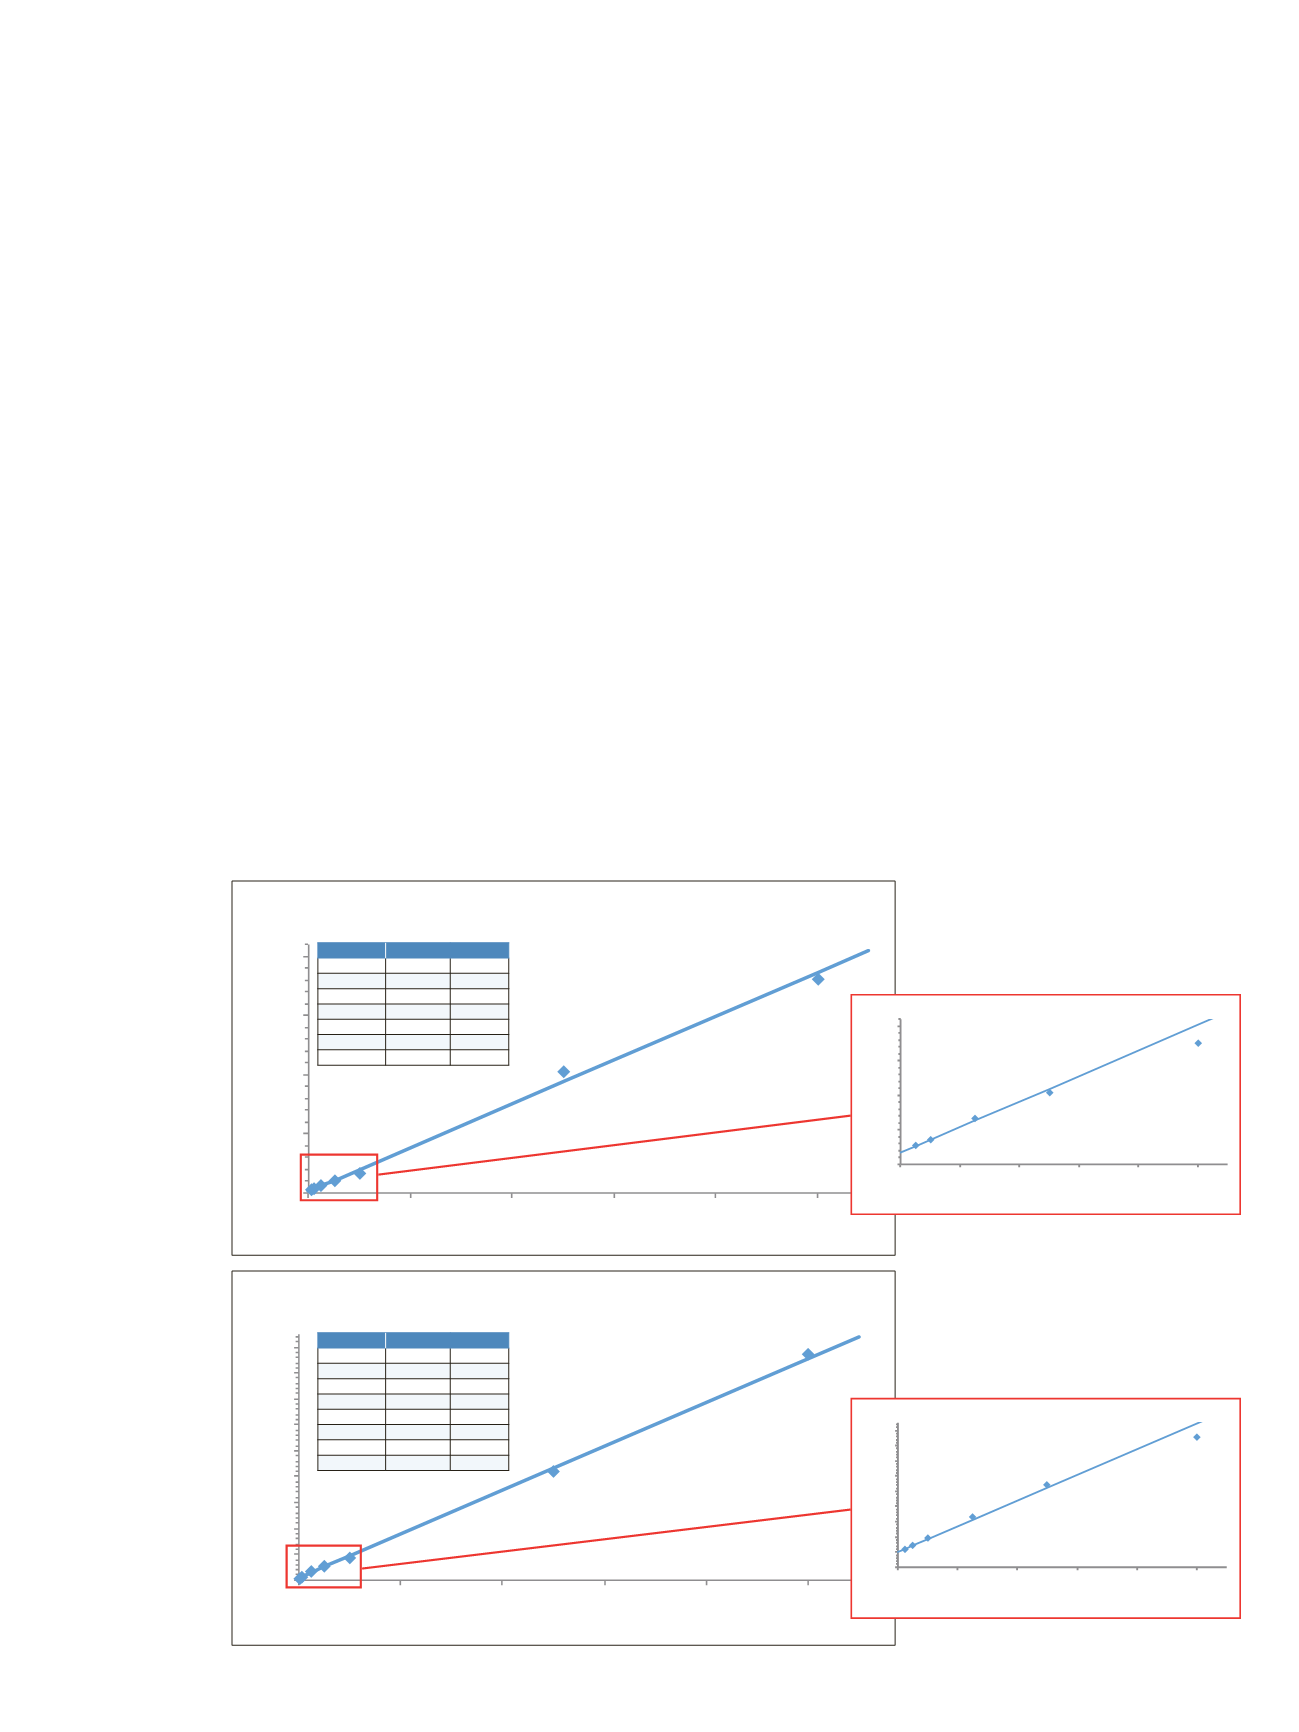
Both compounds were linear over a wide dynamic range.
EtG was linear from 50 to 50,000 ng/mL, while EtS had a
range of 25 to 50,000 ng/mL. Figure 2 shows representative
calibration curves for both compounds. Figure 3 shows
representative chromatograms for EtG and EtS at their
respective LOQs.
0
0.5
1
1.5
2
0
2000
4000
6000
8000
10000
Area Ratio
ng/mL
EtG
Y = 1.852e-4X + 1.709e-2; R^2: 0.9953; Origin: Ignore; W: 1/X; Area
0
0.05
0.1
0.15
0.2
0
200
400
600
800
1000
Area Ratio
Theoretical
Calculated
%Diff
50
54.962
9.92
100
97.747
-2.25
250
266.942
6.78
500
470.273
-5.95
1000
854.373
-14.6
5000
5450.4
9.01
10000
9705.303
-2.95
Figure 2. Representative calibration curves for EtG (top) and EtS (bottom) in urine
0
2
4
6
8
10
12
14
16
18
0
2000
4000
6000
8000
10000
Area Ratio
ng/mL
EtS
Y + 1.687e-3X + 2.021e-1; R^2: 0.9985; Origin: Ignore; W: 1/X; Area
Theoretical
Calculated
%Diff
25
22.269
-10.9
50
50.799
11.6
100
108.127
8.13
250
272.582
9.03
500
519.572
3.91
1000
890.546
-10.9
5000
4855.946
-2.88
10000
10204.859
2.05
0
0.5
1
1.5
2
0
2000
4000
6000
8000
10000
Area Ratio
ng/mL
EtG
Y = 1.852e-4X + 1.709e-2; R^2: 0.9953; Origin: Ignore; W: 1/X; Area
0
0.05
0.1
0.15
0.2
0
200
400
600
800
1000
Area Ratio
ng/mL
0
2
4
6
8
10
12
14
16
18
0
2000
4000
6000
8000
10000
Area Ratio
ng/mL
EtS
Y + 1.687e-3X + 2.021e-1; R^2: 0.9985; Origin: Ignore; W: 1/X; Area
0
0.2
0.4
0.6
0.8
1
1.2
1.4
1.6
1.8
0
200
400
600
800
1000
Area Ratio
ng/mL


