
3
Codeine
Hydrocodone Hydromorphone Morphine
Oxycodone
Oxymorphone
5 ng/mL
% RSD
3.82
3.67
3.89
7.54
2.78
3.43
% Bias
-4.11
7.20
5.28
0.18
-6.19
-2.04
10 ng/mL
% RSD
4.13
6.06
2.79
4.35
3.35
2.78
% Bias
-7.00
-3.47
-0.20
-6.15
-5.24
-3.60
100 ng/mL
% RSD
3.00
6.13
2.03
2.28
2.58
1.62
% Bias
7.43
5.51
-0.16
0.98
5.34
0.26
1000 ng/mL
% RSD
3.63
4.21
1.35
2.52
1.99
2.29
% Bias
6.07
3.64
3.53
4.67
5.44
2.86
Table 1. Inter-assay precision and bias.
Maximum %RSD
from Three Runs
5 ng/mL
10 ng/mL
100 ng/mL
1000 ng/mL
Codeine
5.09
4.56
3.61
3.34
Hydrocodone
3.55
5.60
6.38
4.25
Hydromorphone
3.16
1.87
2.41
1.90
Morphine
8.25
4.52
2.77
3.64
Oxycodone
3.27
3.27
2.85
2.31
Oxymorphone
4.28
3.04
1.78
2.73
Table 2. Intra-assay precision.
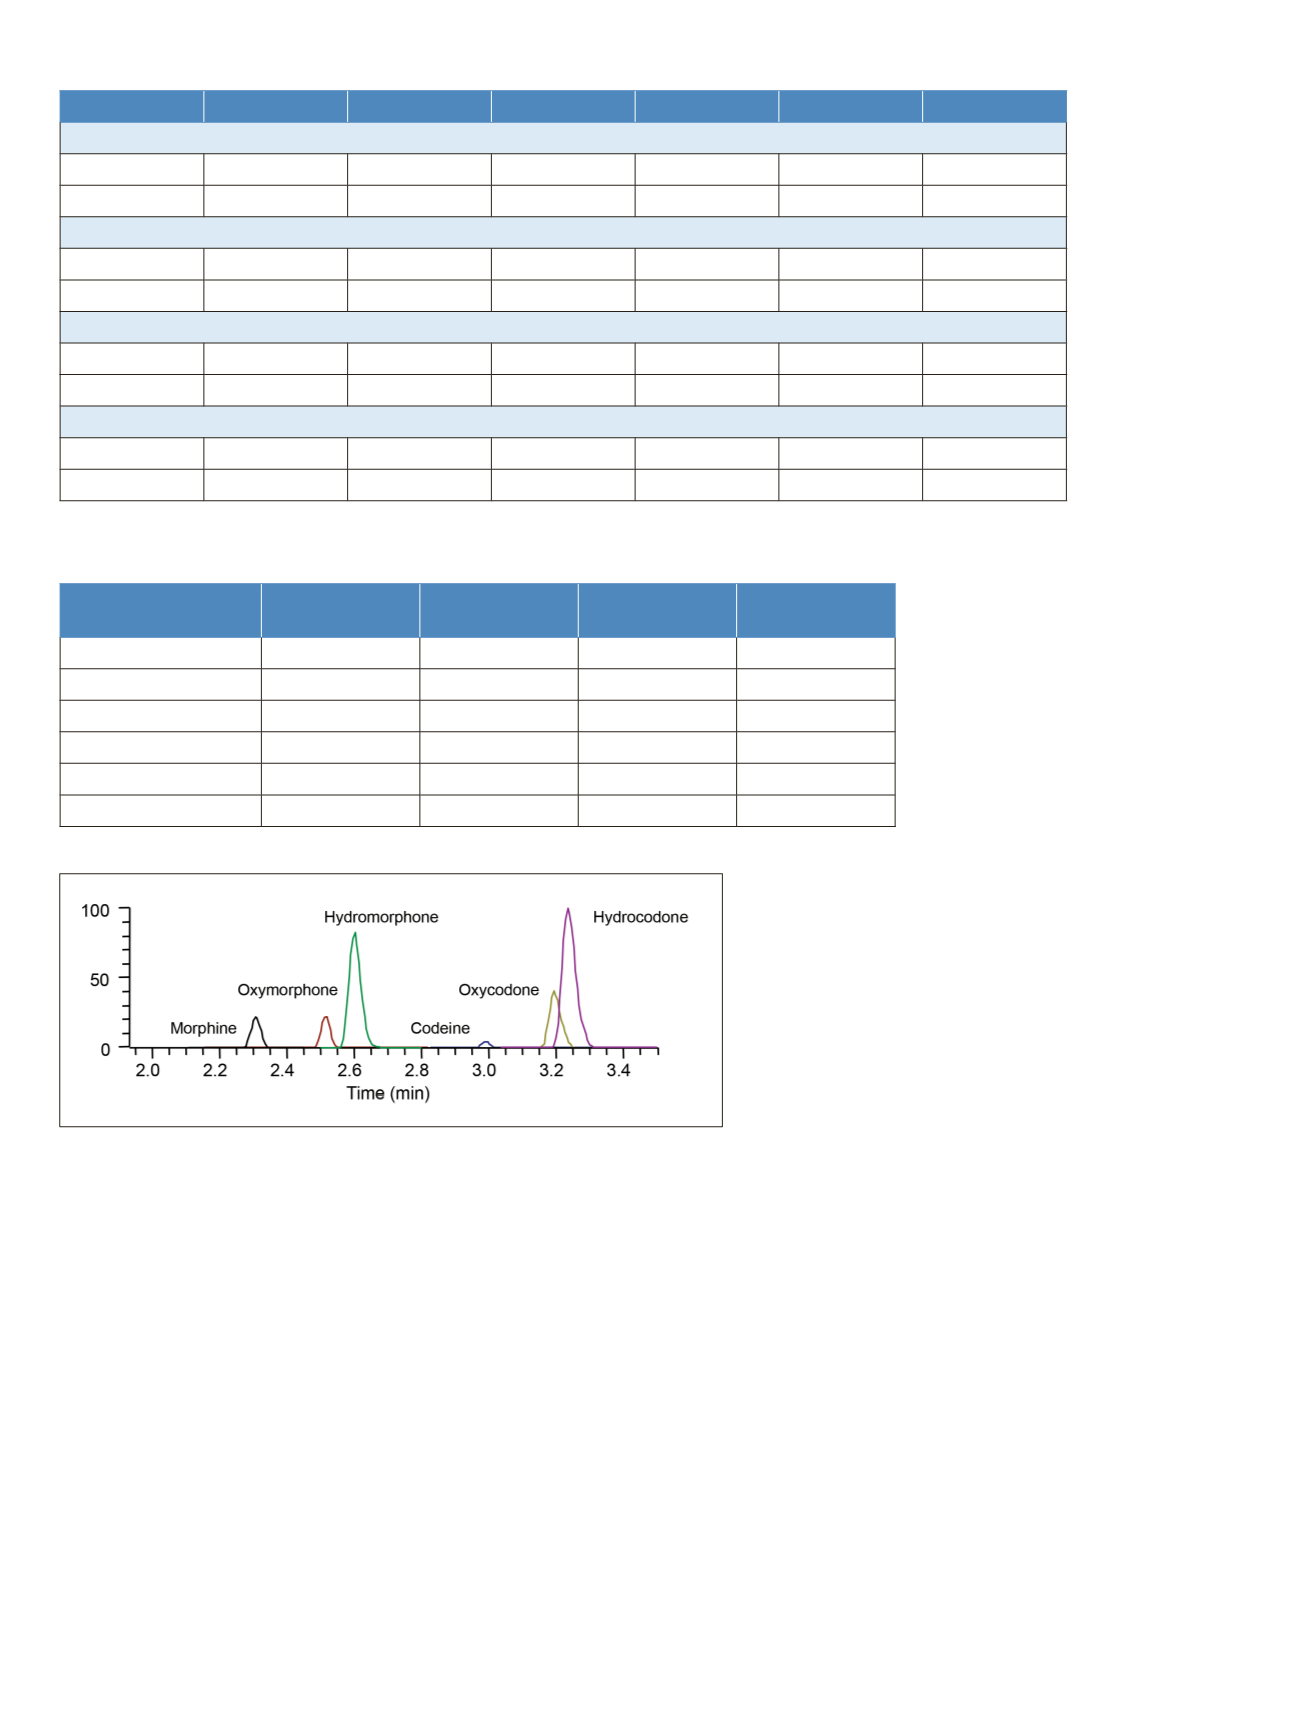
Figure 3. Chromatograms extracted from MS
2
spectra obtained from a confirmation PRM
experiment for six opiates at their respective LOQs (2.5 ng/mL for codeine, oxycodone,
and oxymorphone , and 5 ng/mL for hydrocodone, hydromorphone, and morphine) in
hydrolyzed and diluted urine.


