
2
Data Analysis
Data was acquired and processed using
Thermo Scientific ™ TraceFinder ™ software.Two product
ions were selected as the quantifying and confirming ions
for each compound. The resulting chromatograms were
extracted and reconstructed with a mass accuracy of
5 ppm for quantification and ion ratio confirmation.
Because the entire MS/MS spectrum was collected,
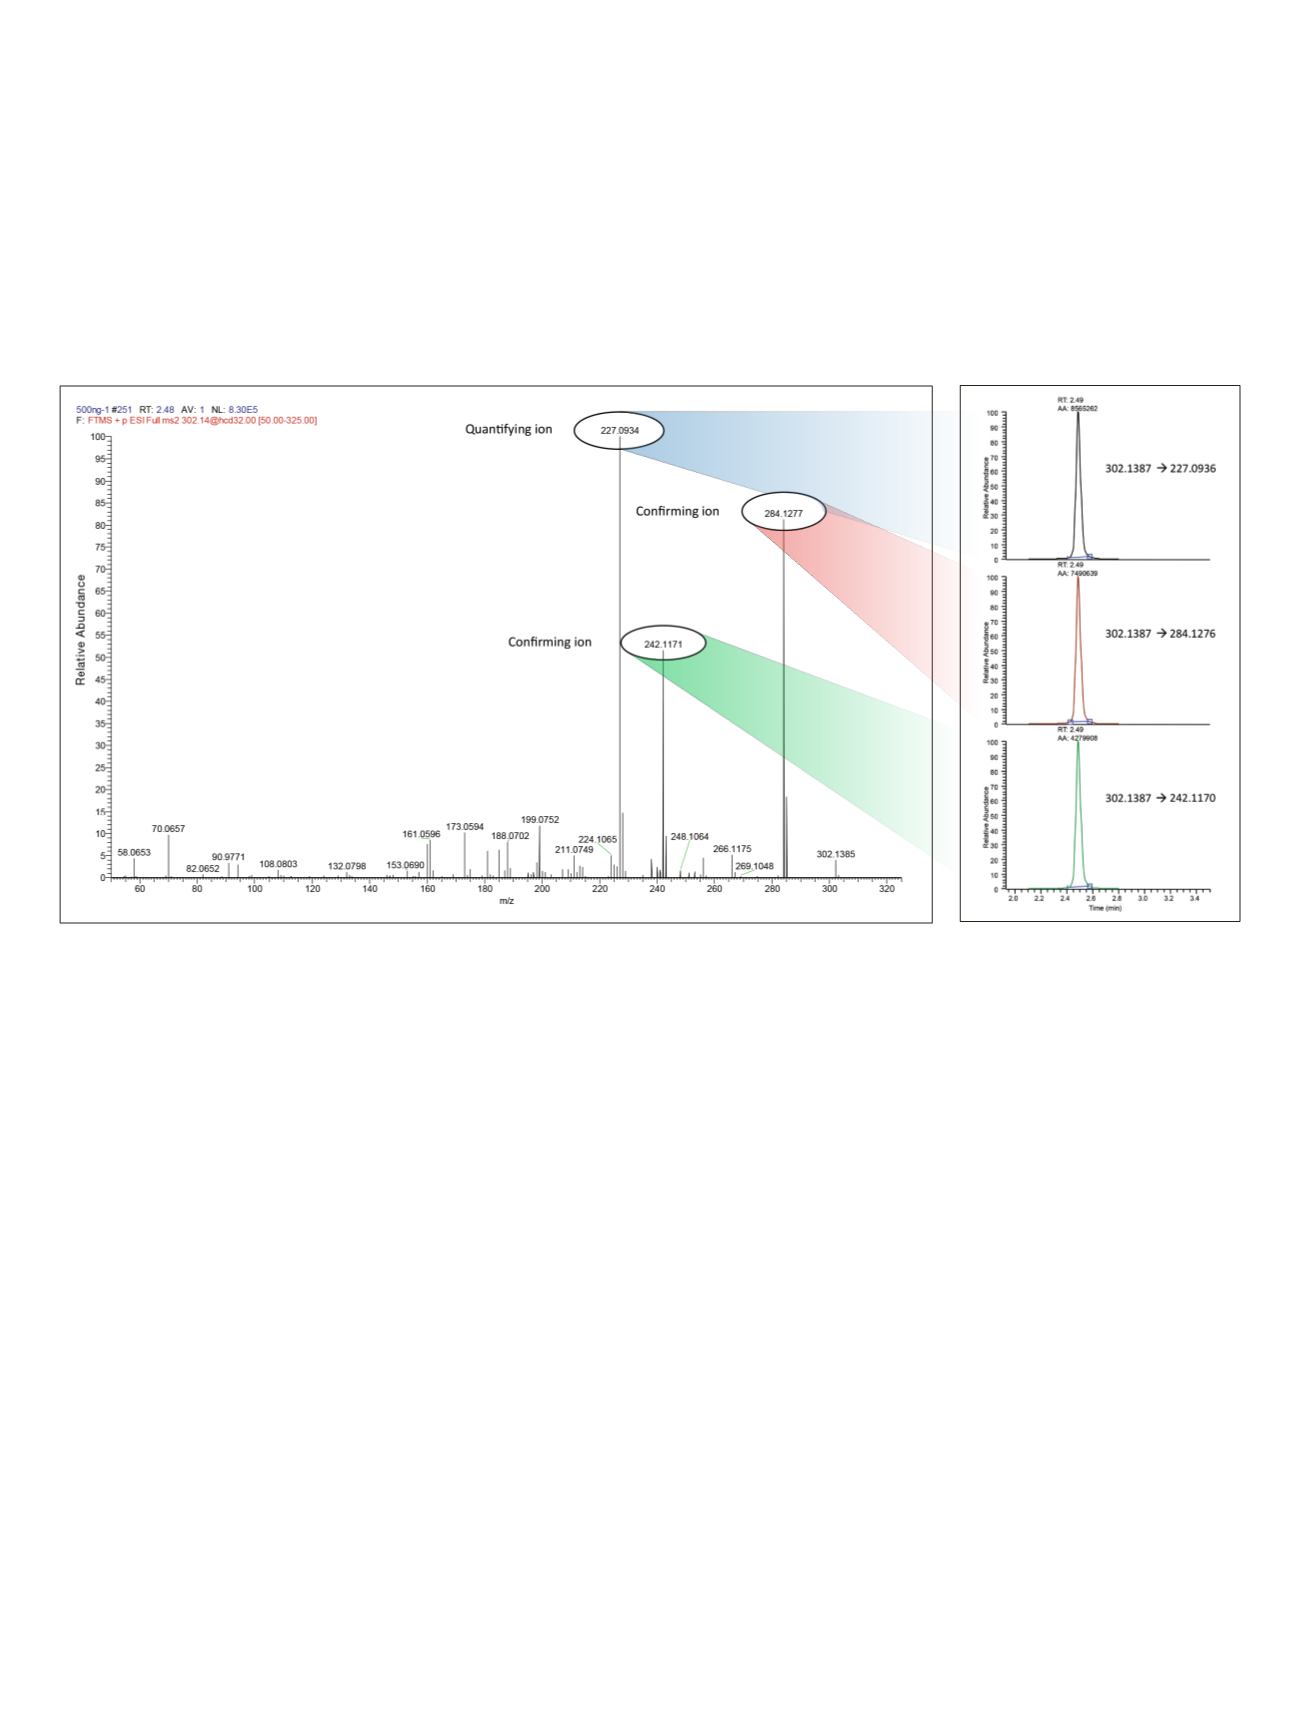
multiple confirming ions could be chosen. Figure 2 shows
a representative MS/MS spectrum for oxymorphone,
highlighting the quantifying and confirming ions with
corresponding reconstructed chromatograms.
Results
Limits of quantitation (LOQs) were defined as the lowest
concentrations that had back-calculated values within
20%, ion ratios within defined tolerance (tolerance
dependent upon actual ratio), and quality controls within
20% RSD as well as meeting the above two requirements.
Using these criteria, limits of quantitation for codeine,
oxycodone, and oxymorphone were determined to be
2.5 ng/mL. For morphine, hydrocodone, and
hydromorphone, the limit was 5 ng/mL. Tables 1 and 2
show the inter- and intra-assay statistics, respectively, for
quality controls for all compounds in this method.
Limited matrix effects were observed. The average
recovery across 58 donor urine samples obtained from a
collaborator laboratory ranged from 69% to 81% for the
six internal standards evaluated. Figure 3 shows a
combined chromatogram for analytes at their respective
LOQs, and Figure 4 shows chromatograms for each
compound with confirming ion ratio at its LOQ. Figure 5
shows representative calibration curves for all
compounds. Figure 6 shows representative
chromatograms with ion ratio confirmation for donor
samples.
Figure 2. Representative fragmentation spectrum for oxymorphone obtained from a 500 ng/mL calibrator,
highlighting the quantifying and confirming ions and showing corresponding chromatograms reconstructed with
5 ppm mass accuracy.


