


 56 / 302

6
Analysis of Diquat and Paraquat Using UHPLC Orbitrap MS – Method Development, Matrix Effects and Performance
Conclusion
It is demonstrated that high-resolution and high-sensitivity analysis of PQ and DQ can
be carried out using UHPLC Orbitrap MS coupled with an Acclaim Trinity Q1 column.
This method provides the following benefits:
A fast LC, isocratic separation of PQ and DQ in 5 min, without needing tedious
sample preparation;
Minimal interference and matrix effects in the analysis by using a MEW of 5
ppm;
Identification and confirmation of PQ and DQ can be carried out using molecular
ions of PQ and DQ, area ratios of M and (M+1) mass spectral peaks and
product ions of from AIF experiment
The method is sensitive and allowed the direct injection analysis of PQ and DQ
with MDLs (0.05 and 0.15
µ
g/L for PQ and DQ) meet the need of various
regulatory bodies.
References
1. J.E. Norman, K.M. Kuivila, L.H. Nowell, Scientific Investigations Report 2012–
5045, U.S. Department of the Interior and U.S. Geological Survey, 2012.
2. K.C. Wang, S.M. Chen, J.F. Hsu, S.G. Cheng, C.K. Lee. J. Chromatogr. B 876
(2008) 211.
3. J.C. Marr, J.B. King, Rapid Commun. Mass Spectrom. 11 (1997) 479.
4. X.P. Lee, T. Kumazawa, M. Fujishiro, C. Hasegawa, T. Arinobu, H. Seno, A. Ishii,
K. Sato, J. Mass Spectrom. 39 (2004) 1147.
Microsoft
®
Excel
®
are trademarks of Microsoft Corporation. All other trademarks are the property of Thermo Fisher
Scientific and its subsidiaries.
This information is not intended to encourage use of these products in any manners that might infringe the
intellectual property rights of others.
and DQ gave the highest area
ed molecular ion [M]
2+
and radical ion
The deprotonated cation [M – H]
+
t pH 5 mobile phase and was used
.100
184.105
C12H11N2:C12H11N2 p(gss, s/p:40)Chrg 1R: 14000...
183.1 183.2 183.3 183.4 183.5 183.6 183.7 183.8 183.9 184.0 184.1
m/z
0
10
20
30
40
50
60
70
80
90
100
Relative Abundance
183.09167
184.09503
.100
184.105
950
C12H11N2:C12H11N2 p(gss, s/p:40)Chrg 1R: 14000...
183.1 183.2 183.3 183.4 183.5 183.6 183.7 183.8 183.9 184.0 184.1
m/z
0
10
20
30
40
50
60
70
80
90
100
Relative Abundance
183.09167
184.09503
.100
184.105
932
pqdq_lev6_ph50_6_130417111717
#
290
RT:
2.80
AV:
1
NL:
7.59E6
T:
FTMS + p ESI Fullms [70.00-300.00]
183.1 183.2 183.3 183.4 183.5 183.6 183.7 183.8 183.9 184.0 184.1
m/z
0
10
20
30
40
50
60
70
80
90
100
Relative Abundance
183.09157
184.09496
183.15744
184.04536
G. DQ, [M
2+
- H
+
]
+
& [M
2+
-
H
+
]
+
(M+1)
.78 min
+1)
I. Measured, RT: 2.78 min
H. DQ, [M
2+
- H
+
]
+
& [M
2+
-
H
+
]
+
(M+1)
ctral peaks of selected quasi
ponding (M+1) peaks.
d area ratios of the three
.
MS analysis
masses of the three molecular ion
ratios obtained from the XIC of
d DQ. In addition, a CID experiment
product ion information that can be
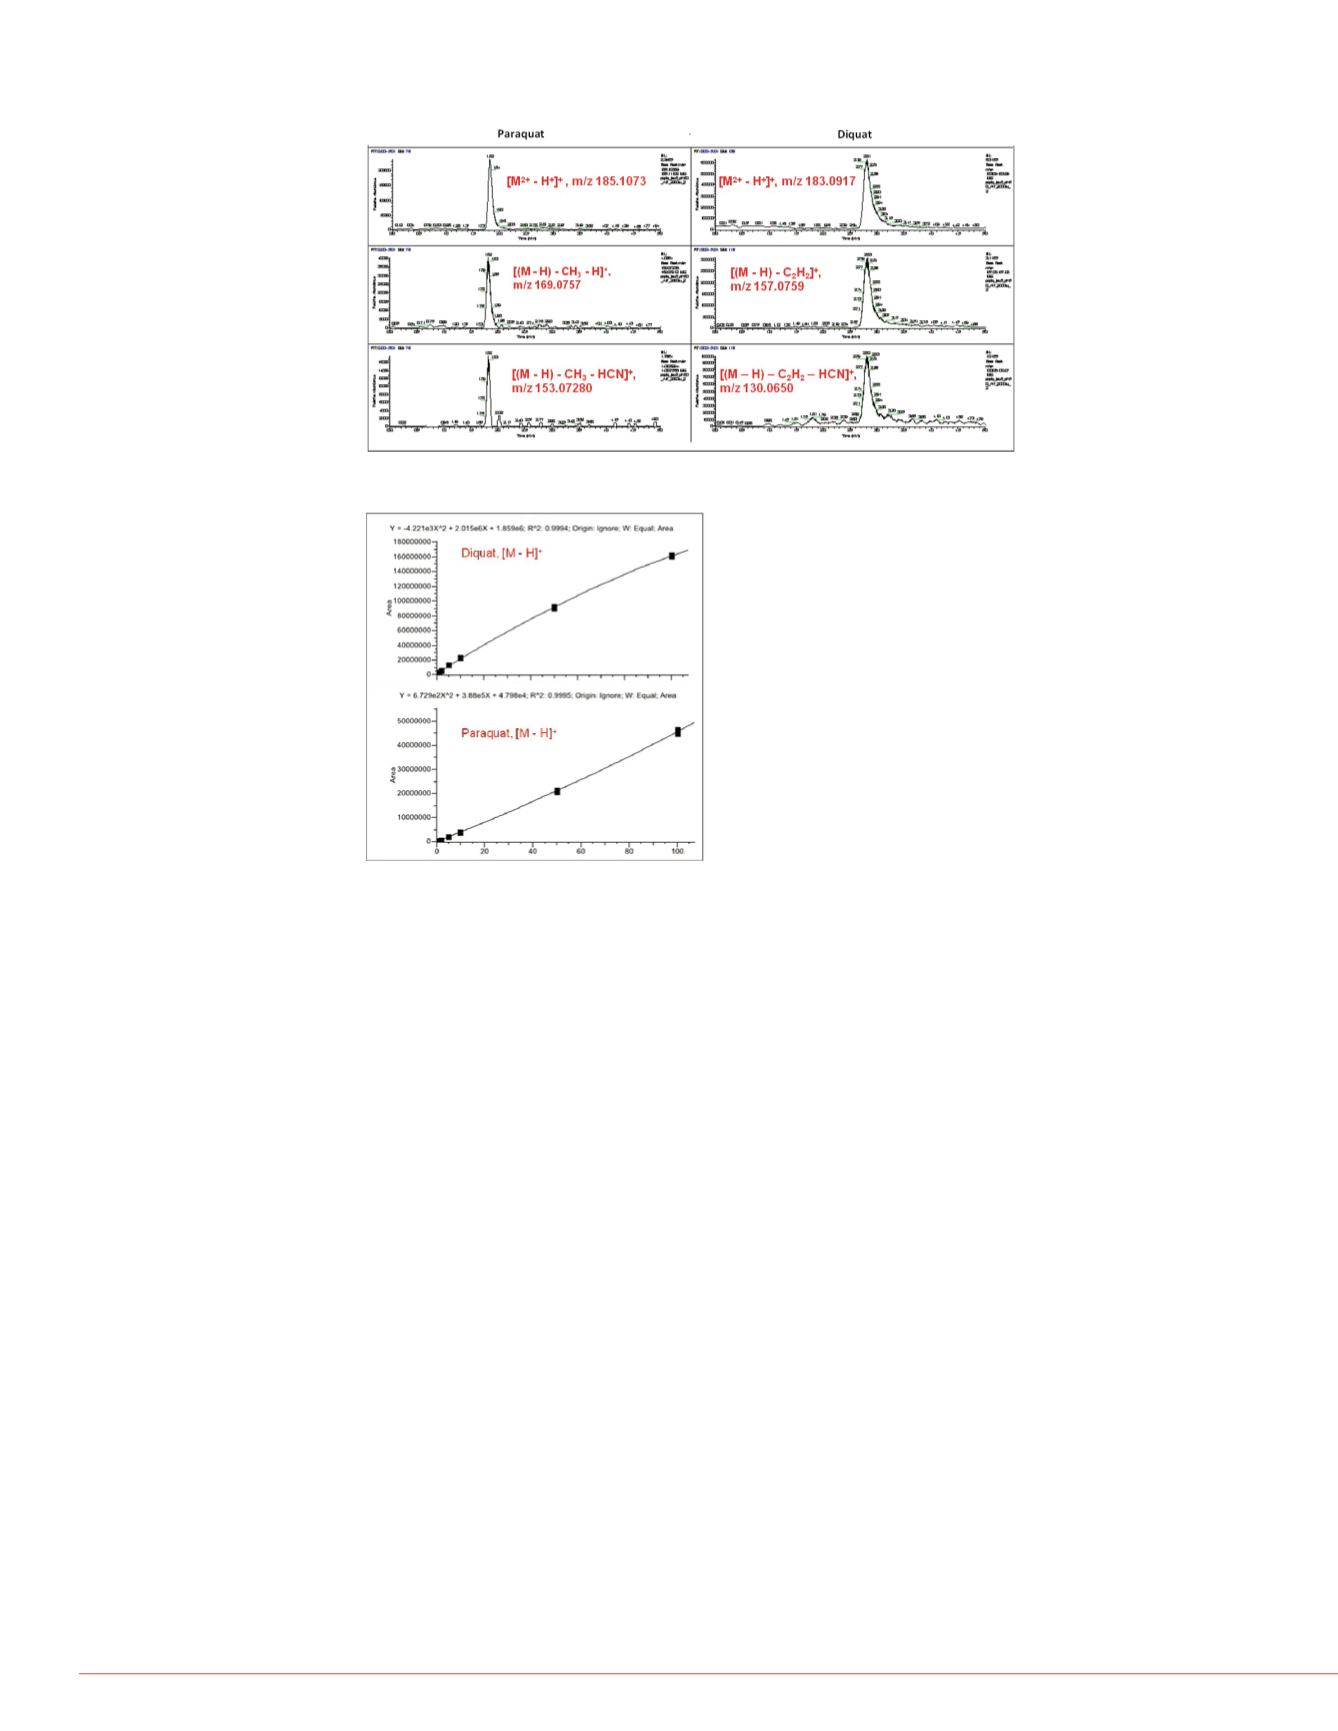
emonstrated in Figure 3 by using
3
– H]
+
) and
m/z
153.07280 ([(M –
593 ([(M – H) – C
2
H
2
]
+
) (Ref. 3) and
analysis (Ref. 4).
FIGURE 3. XICs obtained from product ions of PQ and DQ using AIF experiment
for confirmation.
FIGURE 4. Analytical Performance.
Using deprotonated [M - H]
+
ion of PQ
and DQ, we evaluated the linearity of the
UHPLC Orbitrap MS system with seven
levels of calibration standards in
concentrations ranging from 0.5 to 100
mg/L. The calibration curve is shown in
Figure 4 with good R
2
> 0.9990 for both
compounds.
Initial determination of MDL derived by
using the U.S. EPA protocol was 0.05
and 0.15 mg/L for PQ and DQ. This
direct injection method, when fully
validated, would be able to provide high
sensitivity analysis of PQ and DQ that
will meet different DQO requirements of
various jurisdictions.