


 54 / 302

4
Analysis of Diquat and Paraquat Using UHPLC Orbitrap MS – Method Development, Matrix Effects and Performance
rchased from Ultra Scientific
eat standards of deuterium (D)
ased from CDN Isotope (Pointe-
mediate standard solutions were
Q stock solutions. Five levels of
iluting intermediate solutions with
g reverse osmosis water through a
ter purification system, Mississauga,
Q and DQ, plastic labware and/or
orption onto the glass surfaces.
ONH
4
), acetic acid (CH
3
COOH) and
ma-Aldrich (Oakville, ON, Canada).
from Fisher Scientific (Ottawa, ON,
ction that does not requires sample
ted in a 500 mL polypropylene bottle
water samples were analyzed as is
h a 0.2
µ
filter prior to analysis. A 1 mL
L plastic autosampler vial, spiked
rds to the concentration of 5 ng/mL,
lysis.
hy
00 UHPLC used in the analysis
3000 autosampler, and a TCC-3400
on a mixed-mode column Acclaim
cratic elution and mobile phase of
75:25 v/v, at a flow rate 0.45 mL/min.
DQ were eluted within 5 minutes.
the same composition used in the
. Flow injection analysis was done by
one tubing at a flow rate of 0.4 mL/min
and declustering potential used in the
ific™ Exactive™ Plus Orbitrap MS
system was tuned and calibrated in
f MSCAL5. High purity nitrogen
s well as in a higher energy collisional
d dissociation (CID) experiment
entation” (AIF). The AIF experiment
CE) of 35 14 eV. The UHPLC flow
chromatographic FWHM of 6-8
d using a spray voltage (SV, the
n Orbitrap MS resolving power of
m peak width at
m/z
200, R
FWHM
),
n using automatic gain control and a
nine data points were available to
he UHPLC separation of PQ and DQ.
ferent quasi molecular ions of PQ and
3200 V.
using Thermo Scientific™ Xcalibur™,
g packages depending on the need.
for graphic presentation. ExactFinder
uantitative data. Depending on the
ppm (part-per-million) from both
and quantitative analysis. Results
pilation and statistical evaluation.
Results
Flow Injection Analysis
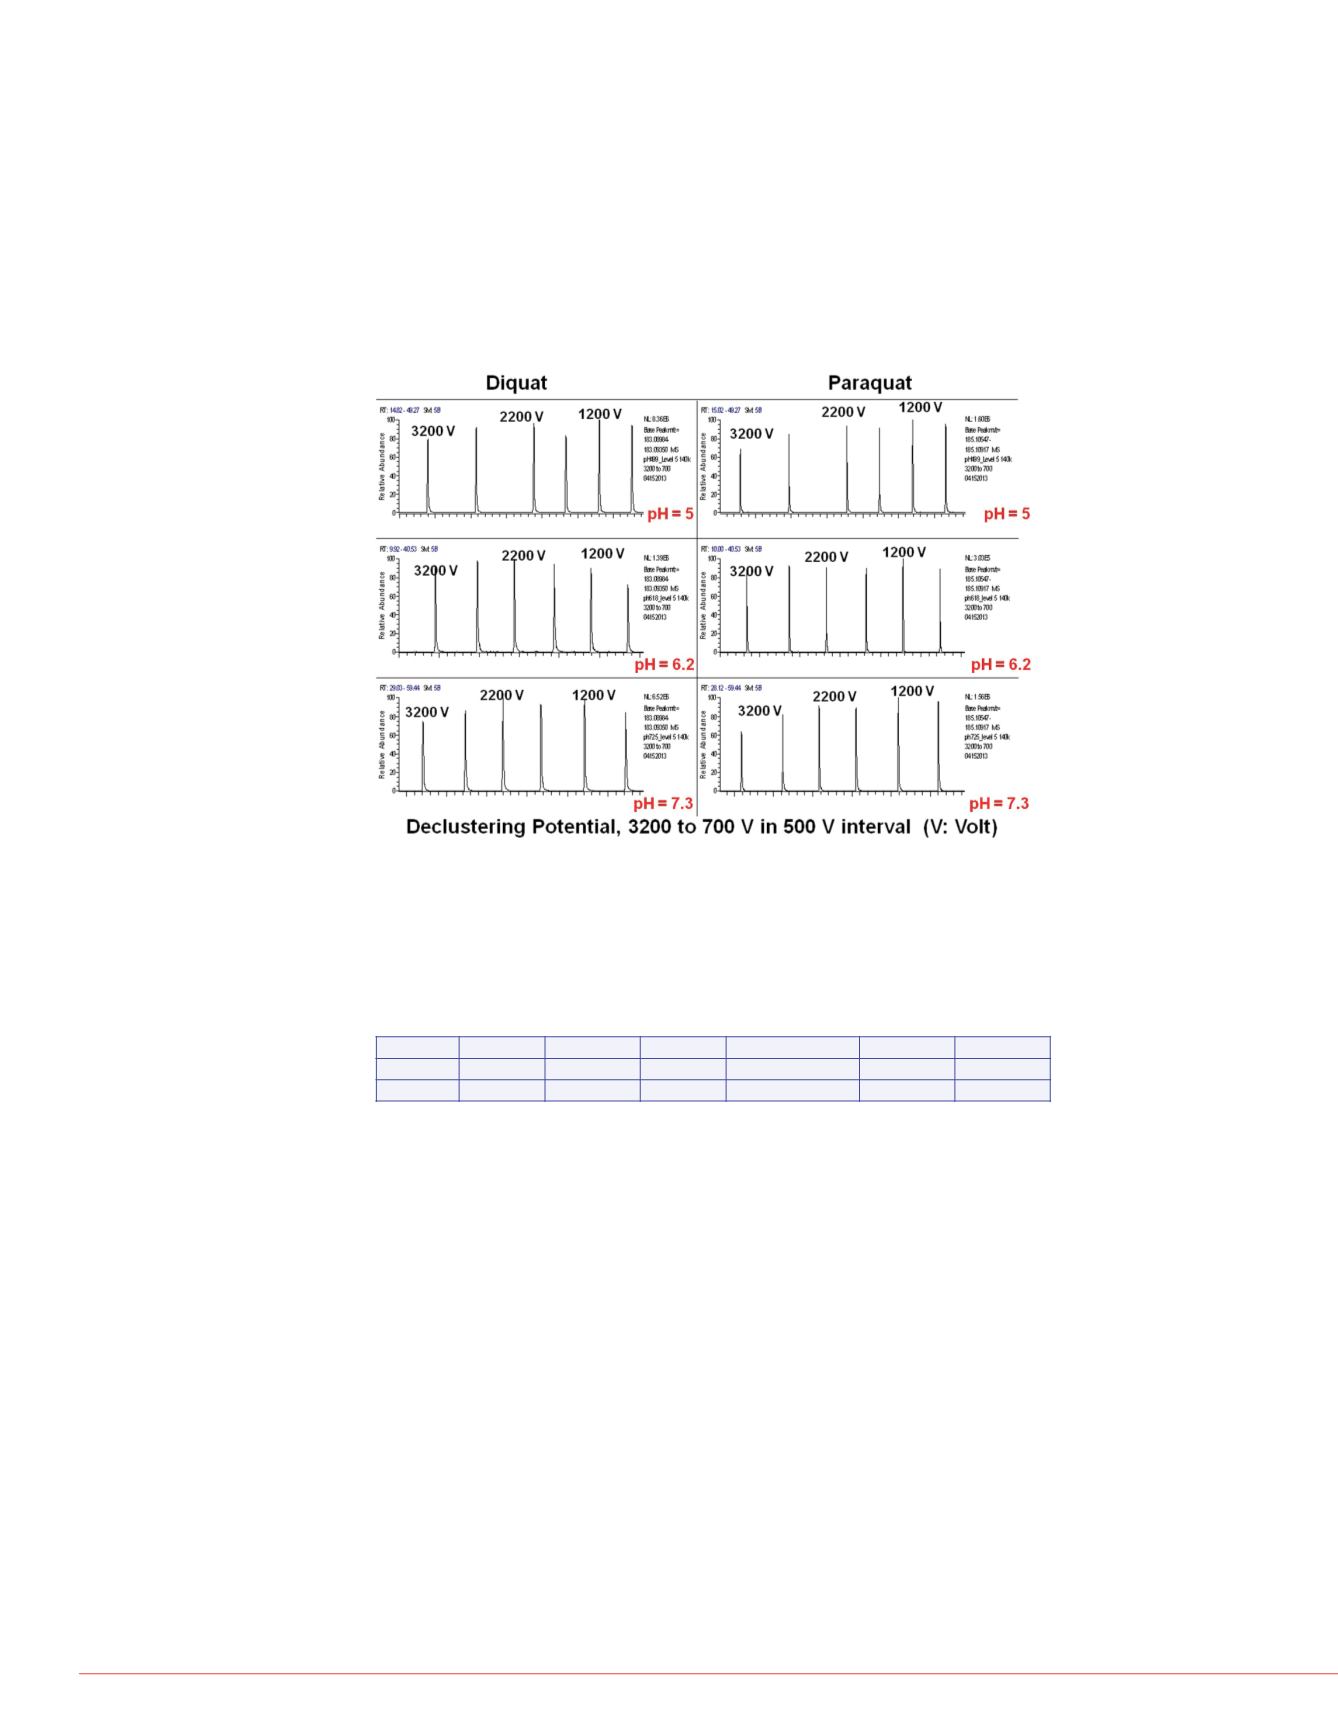
Figure 1 shows results from the flow injection analysis of PQ and DQ using mobile
phases of three different pH values (i.e., 5, 6.2 and 7.3) at declustering potential (DP)
from 3200 to 700 volts, in decreasing intervals of 500 volts. The purpose of this
experiment was to determine an optimal DP such that maximal signal-to-noise ratio
(SNR) of PQ and DQ measurement can be achieved in this study. Peak intensities
were minimal for PQ and DQ at pH 3.5 and were not shown in the figure. It is evident
that DP had very little effect on the sensitivity of PQ and DQ analysis. As a result, a
DP of 2000 volts is used throughout this work.
FIGURE 1. Results of flow injection analysis.
Effect of mobile phase pH on the analysis of PQ and DQ
Table 1 lists accurate mass of the three possible quasi molecular ions of PQ and DQ,
(i.e., molecular ion M
2+
, deprotonated cation [M – H]
+
and the singly charged radical ion
[M]
+
.
), along with their respective
13
C-isotope (M+1) mass spectral peaks. Identification
of PQ and DQ can be achieved by accurate mass of the three quasi molecular ions, their
respective (M+1) peak and fragment ions obtained from the AIF experiment.
M
2+
M
2+
(M+1) [M
2+
- H
+
]
+
[M
2+
- H
+
]
+
(M+1) [M]
+
.
[M]
+
.
(M+1)
Diquat
92.04948 92.55117 183.09167 184.09503 184.09950 185.10289
Paraquat
93.05730 93.55900 185.10732 186.11071 186.11515 187.11854
Figure 2 shows mass spectral peaks listed in Table 1 for PQ ([M
2+
- H
+
]
+
), A (simulated)
and C (measured); DQ ([M]
+ .
(M+1)), B (simulated) and C (measured); DQ ([M
2+
- H
+
]
+
(M+1)), D (simulated) and F (measured); DQ ([M]+), E (simulated) and F (measured);
as well as DQ ([M
2+
- H
+
]
+
) and DQ ([M
2+
- H
+
]
+
(M+1)), shown as simulated (G or H)
and measured (I), as an example. It can be seen from Figure 1 that Orbitrap MS
delivers excellent mass accuracy measurement and matched perfectly with those
theoretically simulated ones (Figures 2A, 2B, 2D, 2E, 2G and 2H). Diquat has much
better ESI ionization efficiency than PQ, with a mass spectral separation of < 25 ppm,
the use of high resolution MS and a MEW < 5 ppm to separate these interfering peaks
in the MS domain becomes imperative for the accurate determination of PQ.
TABLE 1. Expected
m/z
of PQ and DQ.
From Table 2, deprotonated c
counts and a good RSD follo
[M]
+.
had the lowest area cou
had the best SNR (and the hi
in the analysis.
Table 2 shows average area counts and relative standard deviation (RSD, N = 8)
obtained from the LC analysis of PQ and DQ using mobile phases at three different pH
values (i.e., 5, 6.2 and 7.3) and declustering potential (DP) of 2000 volts. The purpose
of this experiment was to determine an optimal mobile phase pH that can be used in
the LC separation of PQ and DQ.
pqdq_lev6_ph50_6_130417111717
4/17/201311:17:17A
C12H13N2:C12H13N2 p(gss, s/p:40)Chrg 1R: 14000...
185.090
185.095
185.100
185.105
185.110
185.115
m/z
0
10
20
30
40
50
60
70
80
90
100
Relative Abundance
185.10732
C12H12N2:C12H12N2 p(gss, s/p:40)Chrg 1R: 14000...
185.090
185.095
185.100
185.105
185.110
185.115
m/z
0
10
20
30
40
50
60
70
80
90
100
Relative Abundance
185.10286
185.09653
185.10583
pqdq_lev6_ph50_6_130417111717
#
287
RT:
2.77
AV:
1
NL:
1.20E5
T:
FTMS + p ESI Fullms [70.00-300.00]
185.090
185.095
185.100
185.105
185.110
185.115
m/z
0
10
20
30
40
50
60
70
80
90
100
Relative Abundance
185.10718
185.10278
185.09831
185.09186
A. PQ, [M
2+
- H
+
]
+
C. Measured, RT 2.77 min
B. DQ, [M]
+
.
(M+1)
FIGURE 2. Simulated and m
molecular ions of PQ and D
TABLE 1. Average area cou
molecular ions and their re
Confirmation of PQ and DQ
From Table 2 at pH 5, LC rete
peaks (M) and their respectiv
(M+1) and M peaks can be us
carried out via AIF can also b
used for the confirmation of P
XICs obtained from
m/z
169.0
H) – CH
3
- HCN]
+
) for PQ (Re
m/z
130.06504 ([(M – H) – C
2