


 55 / 302

5
Thermo Scienti c Poster Note
•
PN ASMS13_T597_JBeck_E 07/13S
Conclusion
It is demonstrated that high-re
be carried out using UHPLC O
This method provides the follo
A fast LC, isocratic sepa
sample preparation;
Minimal interference an
ppm;
Identification and confir
ions of PQ and DQ, are
product ions of from AIF
The method is sensitive
with MDLs (0.05 and 0.
regulatory bodies.
References
1. J.E. Norman, K.M. Kuivi
5045, U.S. Department
2. K.C. Wang, S.M. Chen,
(2008) 211.
3. J.C. Marr, J.B. King, Ra
4. X.P. Lee, T. Kumazawa,
K. Sato, J. Mass Spectr
Microsoft
®
Excel
®
are trademarks of Mi
Scientific and its subsidiaries.
This information is not intended to enc
intellectual property rights of others.
lysis of PQ and DQ using mobile
d 7.3) at declustering potential (DP)
500 volts. The purpose of this
that maximal signal-to-noise ratio
ved in this study. Peak intensities
not shown in the figure. It is evident
Q and DQ analysis. As a result, a
Q and DQ
quasi molecular ions of PQ and DQ,
H]
+
and the singly charged radical ion
1) mass spectral peaks. Identification
of the three quasi molecular ions, their
d from the AIF experiment.
2+
- H
+
]
+
(M+1) [M]
+
.
[M]
+
.
(M+1)
184.09503 184.09950 185.10289
186.11071 186.11515 187.11854
le 1 for PQ ([M
2+
- H
+
]
+
), A (simulated)
d) and C (measured); DQ ([M
2+
- H
+
]
+
]+), E (simulated) and F (measured);
+1)), shown as simulated (G or H)
from Figure 1 that Orbitrap MS
nd matched perfectly with those
2E, 2G and 2H). Diquat has much
ass spectral separation of < 25 ppm,
m to separate these interfering peaks
urate determination of PQ.
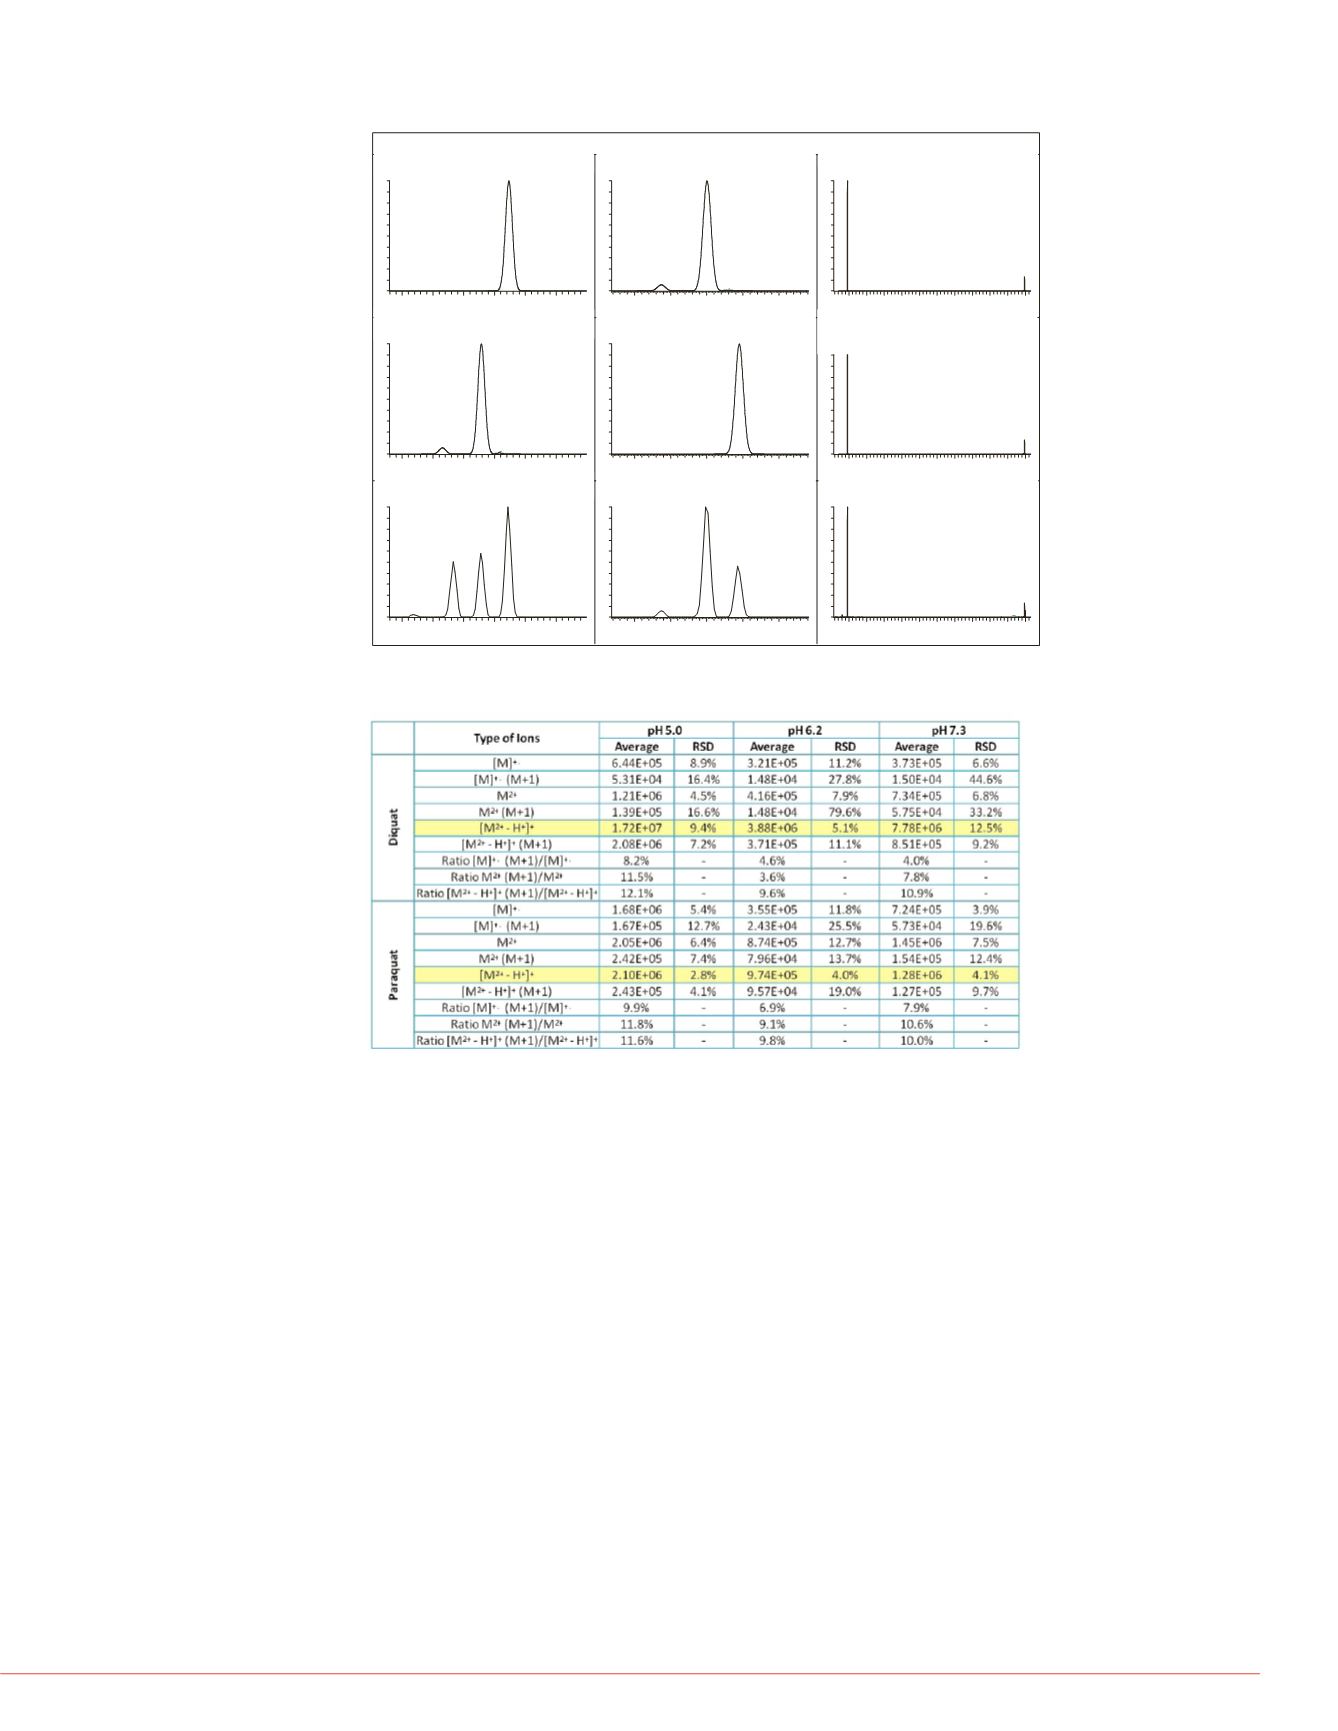
From Table 2, deprotonated cation [M – H]
+
of PQ and DQ gave the highest area
counts and a good RSD followed by doubly-charged molecular ion [M]
2+
and radical ion
[M]
+.
had the lowest area counts at all pH values. The deprotonated cation [M – H]
+
had the best SNR (and the highest area counts) at pH 5 mobile phase and was used
in the analysis.
tandard deviation (RSD, N = 8)
g mobile phases at three different pH
ntial (DP) of 2000 volts. The purpose
obile phase pH that can be used in
pqdq_lev6_ph50_6_130417111717
4/17/201311:17:17AM
C12H13N2:C12H13N2 p(gss, s/p:40)Chrg 1R: 14000...
185.090
185.095
185.100
185.105
185.110
185.115
m/z
0
10
20
30
40
50
60
70
80
90
100
Relative Abundance
185.10732
C12H11N2:C12H11N2 p(gss, s/p:40)Chrg 1R: 14000...
184.085
184.090
184.095
184.100
184.105
m/z
0
10
20
30
40
50
60
70
80
90
100
Relative Abundance
184.09503
184.08871
184.09801
C12H11N2:C12H11N2 p(gss, s/p:40)Chrg 1R: 14000...
183.1 183.2 183.3 183.4 183.5 183.6 183.7 183.8 183.9 184.0 184.1
m/z
0
10
20
30
40
50
60
70
80
90
100
Relative Abundance
183.09167
184.09503
C12H12N2:C12H12N2 p(gss, s/p:40)Chrg 1R: 14000...
185.090
185.095
185.100
185.105
185.110
185.115
m/z
0
10
20
30
40
50
60
70
80
90
100
Relative Abundance
185.10286
185.09653
185.10583
C12H12N2:C12H12N2 p(gss, s/p:40)Chrg 1R: 14000...
184.085
184.090
184.095
184.100
184.105
m/z
0
10
20
30
40
50
60
70
80
90
100
Relative Abundance
184.09950
C12H11N2:C12H11N2 p(gss, s/p:40)Chrg 1R: 14000...
183.1 183.2 183.3 183.4 183.5 183.6 183.7 183.8 183.9 184.0 184.1
m/z
0
10
20
30
40
50
60
70
80
90
100
Relative Abundance
183.09167
184.09503
pqdq_lev6_ph50_6_130417111717
#
287
RT:
2.77
AV:
1
NL:
1.20E5
T:
FTMS + p ESI Fullms [70.00-300.00]
185.090
185.095
185.100
185.105
185.110
185.115
m/z
0
10
20
30
40
50
60
70
80
90
100
Relative Abundance
185.10718
185.10278
185.09831
185.09186
pqdq_lev6_ph50_6_130417111717
#
288
RT:
2.78
AV:
1
NL:
1.03E6
T:
FTMS + p ESI Fullms [70.00-300.00]
184.085
184.090
184.095
184.100
184.105
m/z
0
10
20
30
40
50
60
70
80
90
100
Relative Abundance
184.09496
184.09932
184.08868
pqdq_lev6_ph50_6_130417111717
#
290
RT:
2.80
AV:
1
NL:
7.59E6
T:
FTMS + p ESI Fullms [70.00-300.00]
183.1 183.2 183.3 183.4 183.5 183.6 183.7 183.8 183.9 184.0 184.1
m/z
0
10
20
30
40
50
60
70
80
90
100
Relative Abundance
183.09157
184.09496
183.15744
184.04536
A. PQ, [M
2+
- H
+
]
+
G. DQ, [M
2+
- H
+
]
+
& [M
2+
-
H
+
]
+
(M+1)
F. Measured, RT: 2.78 min
E. DQ, [M]
+
.
D. DQ, [M
2+
- H
+
]
+
(M+1)
C. Measured, RT 2.77 min
B. DQ, [M]
+
.
(M+1)
I. Measured, RT: 2.78 min
H. DQ, [M
2+
- H
+
]
+
& [M
2+
-
H
+
]
+
(M+1)
FIGURE 2. Simulated and measured mass spectral peaks of selected quasi
molecular ions of PQ and DQ and their corresponding (M+1) peaks.
TABLE 1. Average area counts, RSD (N = 8) and area ratios of the three
molecular ions and their respective (M+1) ions.
Confirmation of PQ and DQ in UHPLC-Orbitrap MS analysis
From Table 2 at pH 5, LC retention time, accurate masses of the three molecular ion
peaks (M) and their respective (M+1) peaks, area ratios obtained from the XIC of
(M+1) and M peaks can be used to identify PQ and DQ. In addition, a CID experiment
carried out via AIF can also be useful in producing product ion information that can be
used for the confirmation of PQ and DQ. This is demonstrated in Figure 3 by using
XICs obtained from
m/z
169.07574 ([(M – H) – CH
3
– H]
+
) and
m/z
153.07280 ([(M –
H) – CH
3
- HCN]
+
) for PQ (Ref 4); and
m/z
157.07593 ([(M – H) – C
2
H
2
]
+
) (Ref. 3) and
m/z
130.06504 ([(M – H) – C
2
H
2
– HCN]
+
) for DQ analysis (Ref. 4).
FIGURE 3. XICs obtained fro
for confirmation.
FIGURE 4. Analytical Perfor