


 62 / 302

Sample Measurements
A typical GC-MS batch consisted of matrix-matched
calibration standards, samples, one matrix blank and
one recovery sample for performance check after a set of
every six samples.
The data acquisition was carried out in Full Scan mode
using the compound-specific ions
m/z
76 and 78 (the 34S
isotope, ion ratio 10:1) as extracted chromatograms for a
selective identification of CS
2
.
Results
Sensitivity
The sensitivity of the method was evaluated in terms of
the limit of detection (LOD) and limit of quantification
(LOQ) which were respectively 0.005 and 0.04 µg/mL.
The LOD is the concentration at which the signal to noise
ratio (S/N) for the quantifier ion is > 3, whereas LOQ is
the concentration for which the S/N is > 10.
4
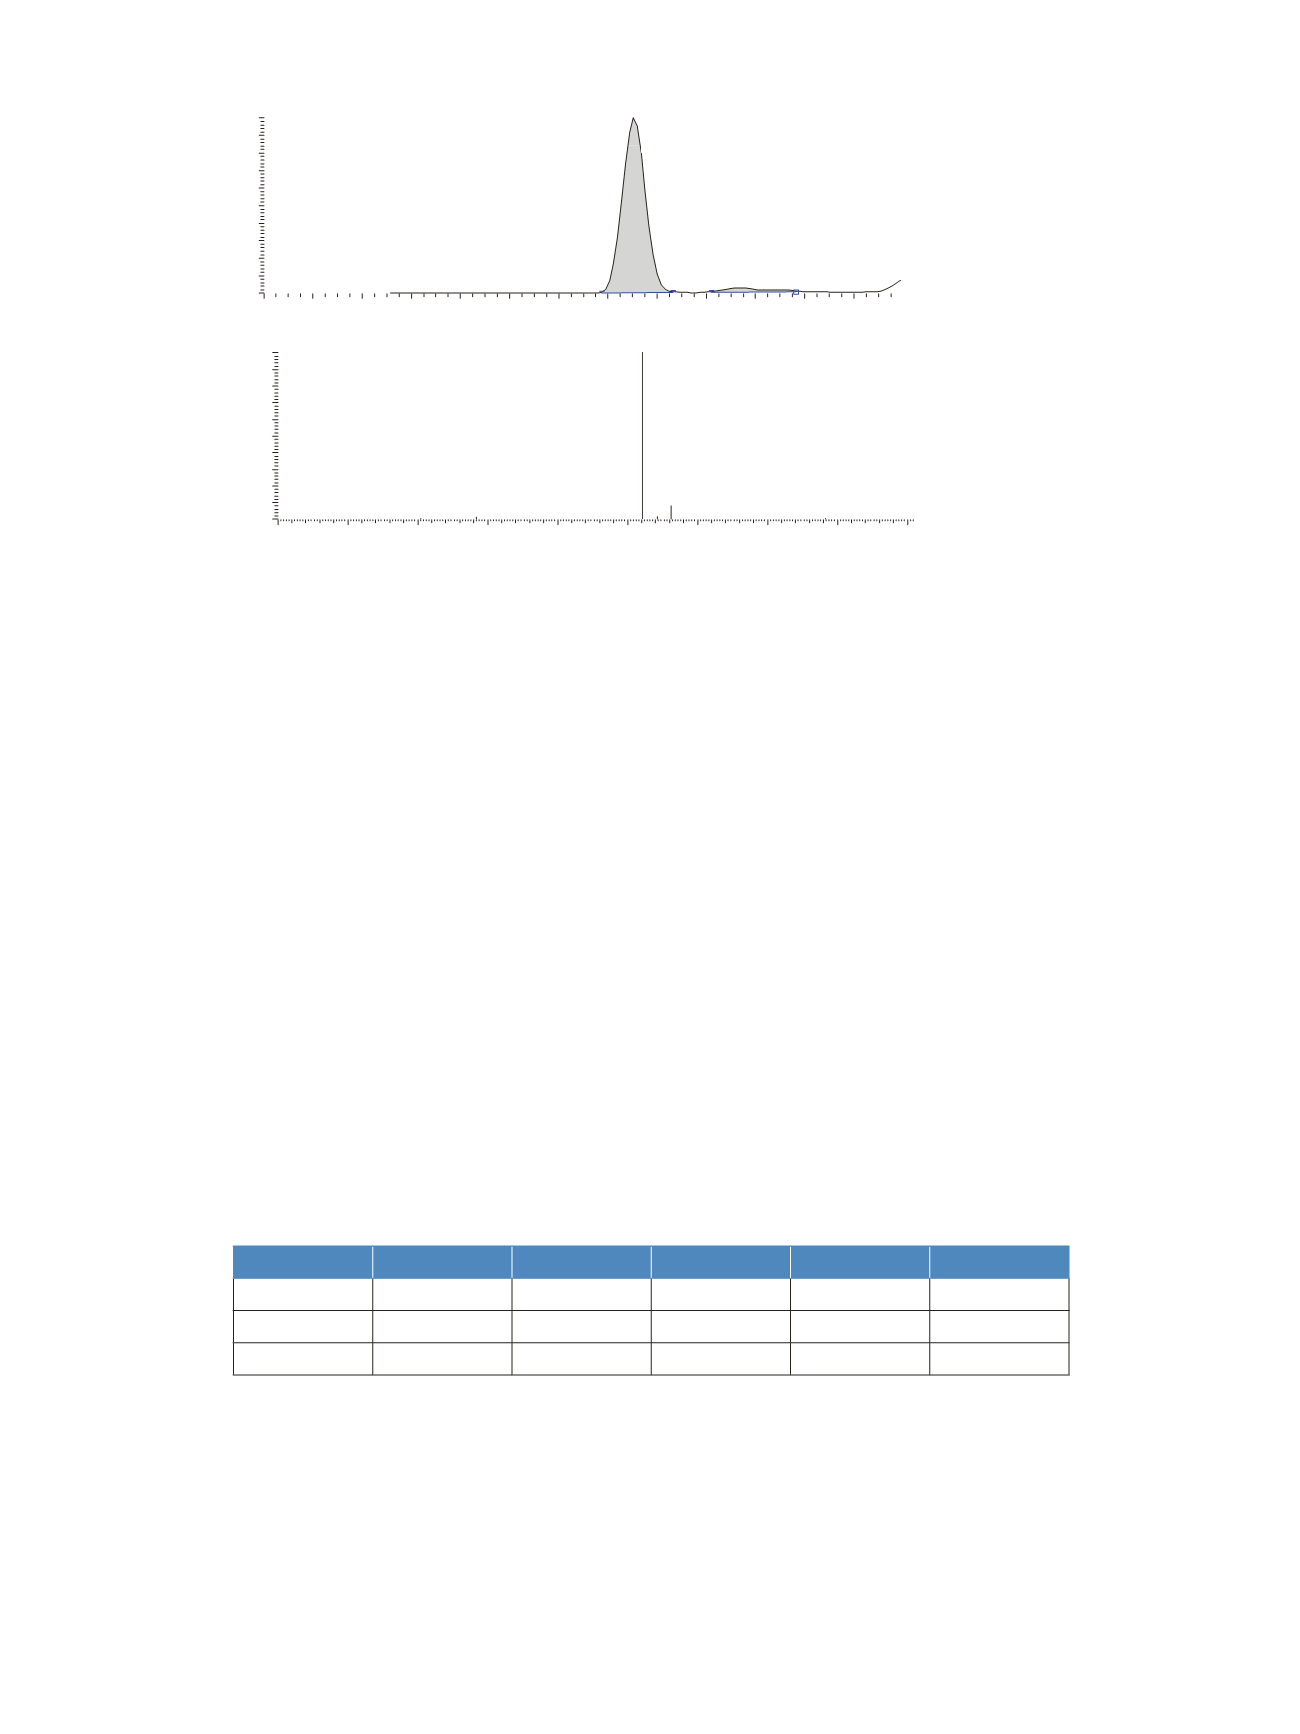
Figure 4
.
Chili sample analysis with confirming CS
2
ion ratio 100:10 for m/z 76:78.
RT:
0.00 2.60
SM:
13G
90
100
RT:1.50
0.0
0.2
0.4
0.6
0.8
1.0
1.2
1.4
1.6
1.8
2.0
2.2
2.4
Time(min)
0
10
20
30
40
50
60
70
80
RelativeAbundance
RT:1.93
30
40
50
60
70
80
90
100
RelativeAbundance
76
50
55
60
65
70
75
80
85
90
95
m/z
0
10
20
78
77
64
89
60
Spike level [ppb]
Grapes [%]
Chili [%]
Potato [%]
Egg plant [%]
Tomato [%]
1300
96 (±4)
81 (±10)
90 (±9)
90(±5)
81 (±4)
160
94 (±10)
80 (±13)
94 (±10)
92 (±8)
85 (±10)
40
104 (±15)
79 (±9)
104 (±15)
86 (±10)
96(±15)
Table 3. Recoveries from different foods:
Recovery
The recovery experiments were carried out on fresh
untreated potato, tomato, eggplant, green chili, and
grapes by fortifying 25 g of the samples with Thiram
solution at 0.04, 0.16, and 1.30 µg/g levels in six
replicates. The control samples of each of the tested
commodities were obtained from an organic farm near
Pune, India, and screened for absence of DTC residues
before spiking. The spiked the samples were extracted
using the sample preparation method described above.
The quantitation of the residues was performed using
matrix matched standards.