


 28 / 302

flow rate of 850 µL/min, the 6-port valve was switched
back to the starting position. The loading and analytical
columns were cleaned with a high organic phase before
being re-equilibrated to their starting conditions. The total
run time for each analysis was six minutes. The mobile
phases for the analysis were water and acetonitrile, both
containing 0.1% formic acid. The gradient profile for each
pump is shown in Figure 2.
The pressure at the beginning of the gradient was
monitored. At a flow rate of 850 µL/min (at the initial
gradient conditions with the flow going through only the
Hypersil GOLD 50
×
2.1 mm, 1.9 µm column), the back-
pressure for the Fast-HPLC system was approximately
450 bar. For comparison, an earlier method which used
a Hypersil GOLD 50
×
2.1 mm, 3 µm column had a
backpressure of approximately 150 bar at a flow rate
of 200 µL/min.
MS
MS analysis was carried out on a TSQ Quantum Access
triple stage quadrupole mass spectrometer with a heated
electrospray ionization (H-ESI) probe (Thermo Scientific,
San Jose, CA). The MS conditions were as follows:
Ion source polarity: Positive ion mode
Spray voltage: 4000 V
Vaporizer temperature: 450°C
Sheath gas pressure (N
2
): 50 units
Auxiliary gas pressure (N
2
): 50 units
Ion transfer tube temperature: 380°C
Collision Gas (Ar): 1.0 mTorr
Q1/Q3 Peak Resolution: 0.7 u
Scan Width: 0.002 u
Results and Discussion
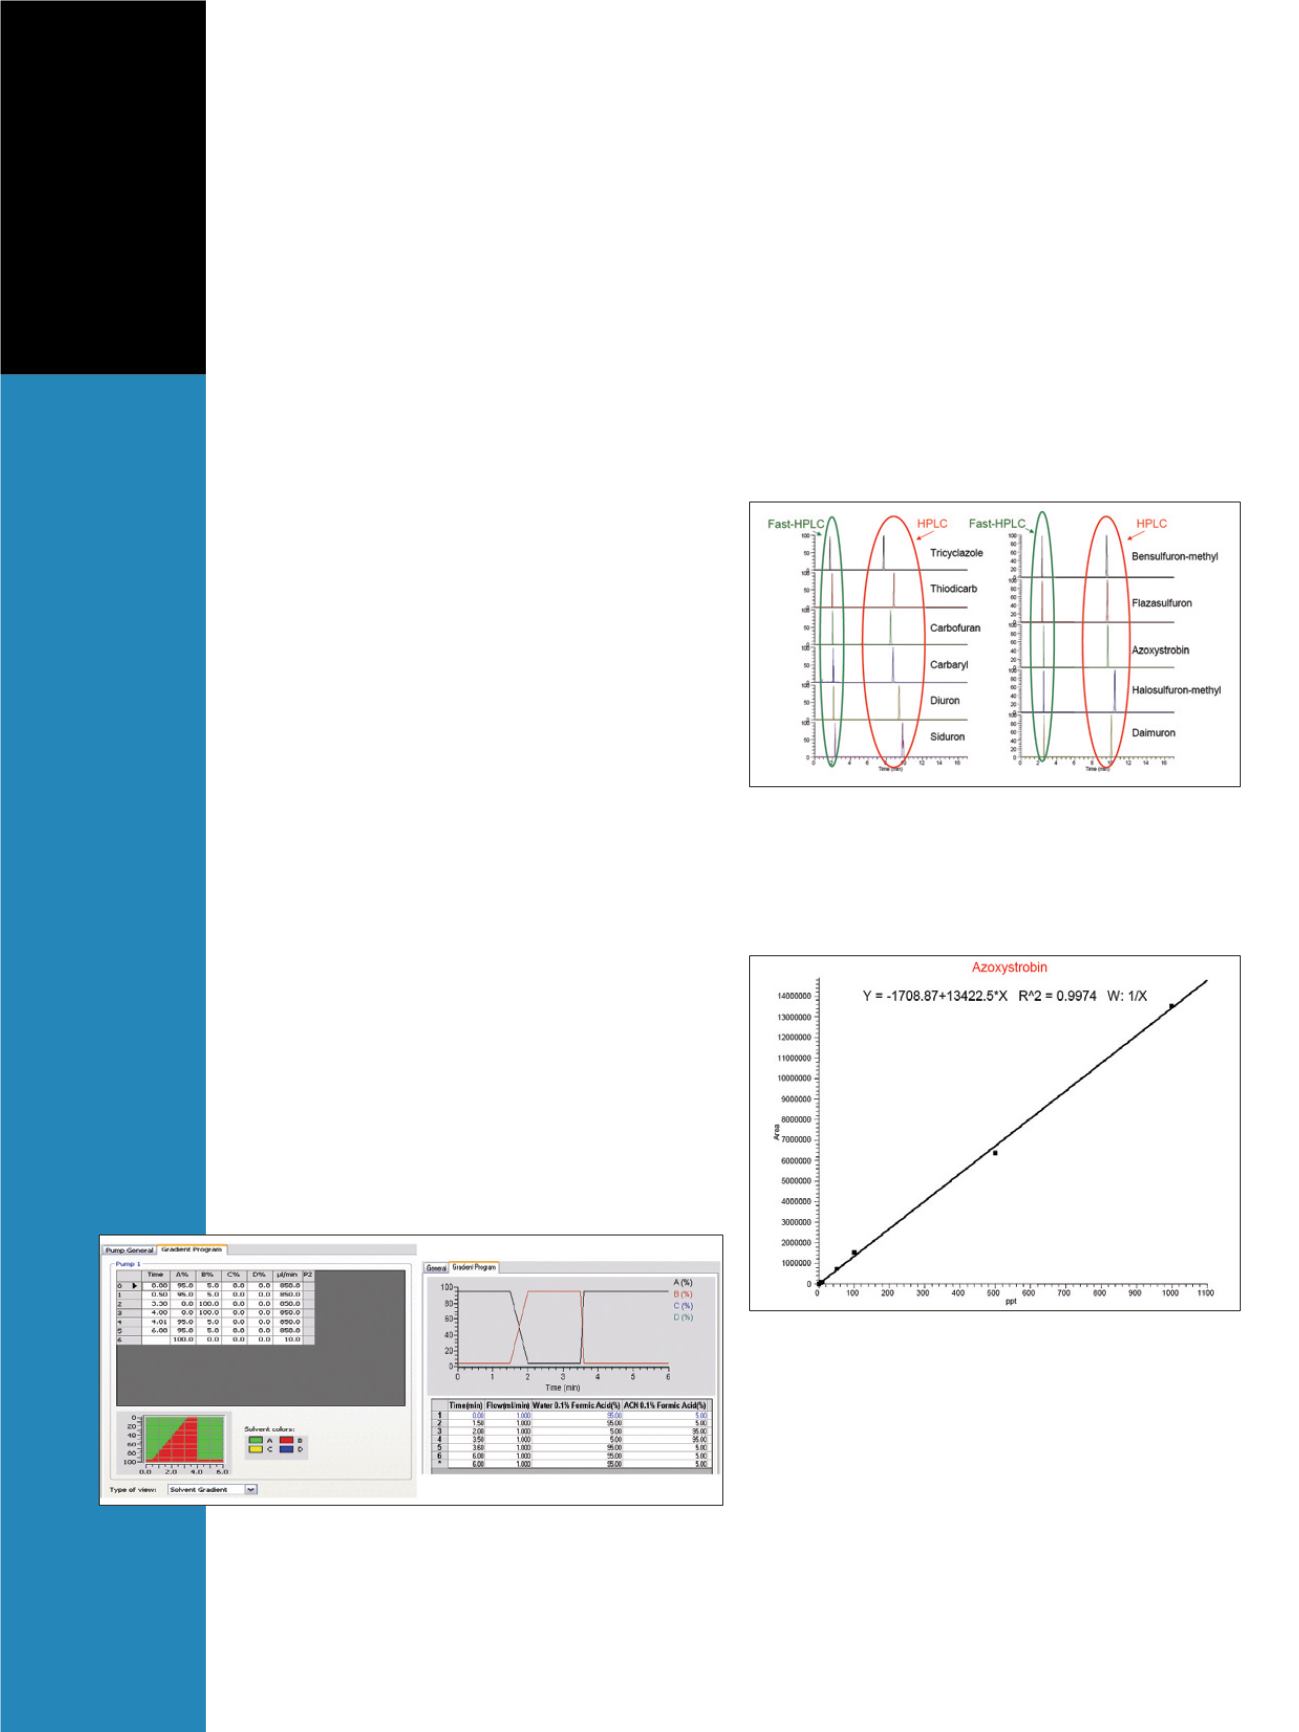
Chromatograms for the calibration standard at a con-
centration of 500 pg/mL are shown in Figure 3. In the
Fast-HPLC run, all 11 of the individual analytes were
eluted before three minutes. In contrast, none of the
analytes in the standard HPLC run were eluted until
nearly eight minutes into the run. Further optimization
of the chromatography for the Fast-HPLC would produce
even shorter run times.
Calibration curves for all 11 compounds were
generated using LC
QUAN
™
2.5 software (Thermo
Scientific, San Jose, CA). Excellent linearity was achieved
for all of the compounds analyzed in this experiment.
Figure 4 shows a representative calibration curve for the
compound azoxystrobin over the concentration range
0.5 to 1000 pg/mL (ppt). The calibration curve fit
parameters and the limits of detection for the analytes
are summarized in Table 2. The final column in the table
lists the Minimum Performance Reporting Limit (MPRL)
for these compounds as set by the Japanese Ministry of
Health, Labour, and Welfare
1
. All of the compounds
were detected and quantified at levels well below these
regulatory requirements.
Figure 2: Gradient profiles for the two LC pumps used in this experiment.
The Fast-HPLC pump gradient is shown on the left, and the loading pump
gradient is show on the right.
Figure 3: Chromatograms showing the SRMs for each of the components in
the mixture. Two different HPLC conditions are shown: the Fast-HPLC run
and the standard HPLC run. All compounds in the Fast-HPLC run are eluted
in less than three minutes (circled in green). Those in the standard HPLC
run are eluted much later (circled in red). These chromatograms represent
a calibration level of 500 pg/mL (ppt).
Figure 4: Calibration curve for the compound azoxystrobin. This calibration
curve covers the range from 0.5 to 1000 pg/mL (ppt)