


 32 / 302

Results and Discussion
The analyst can select in which area to begin working
(Figure 1). In this application note, the entire process will
be illustrated, from method development to reporting.
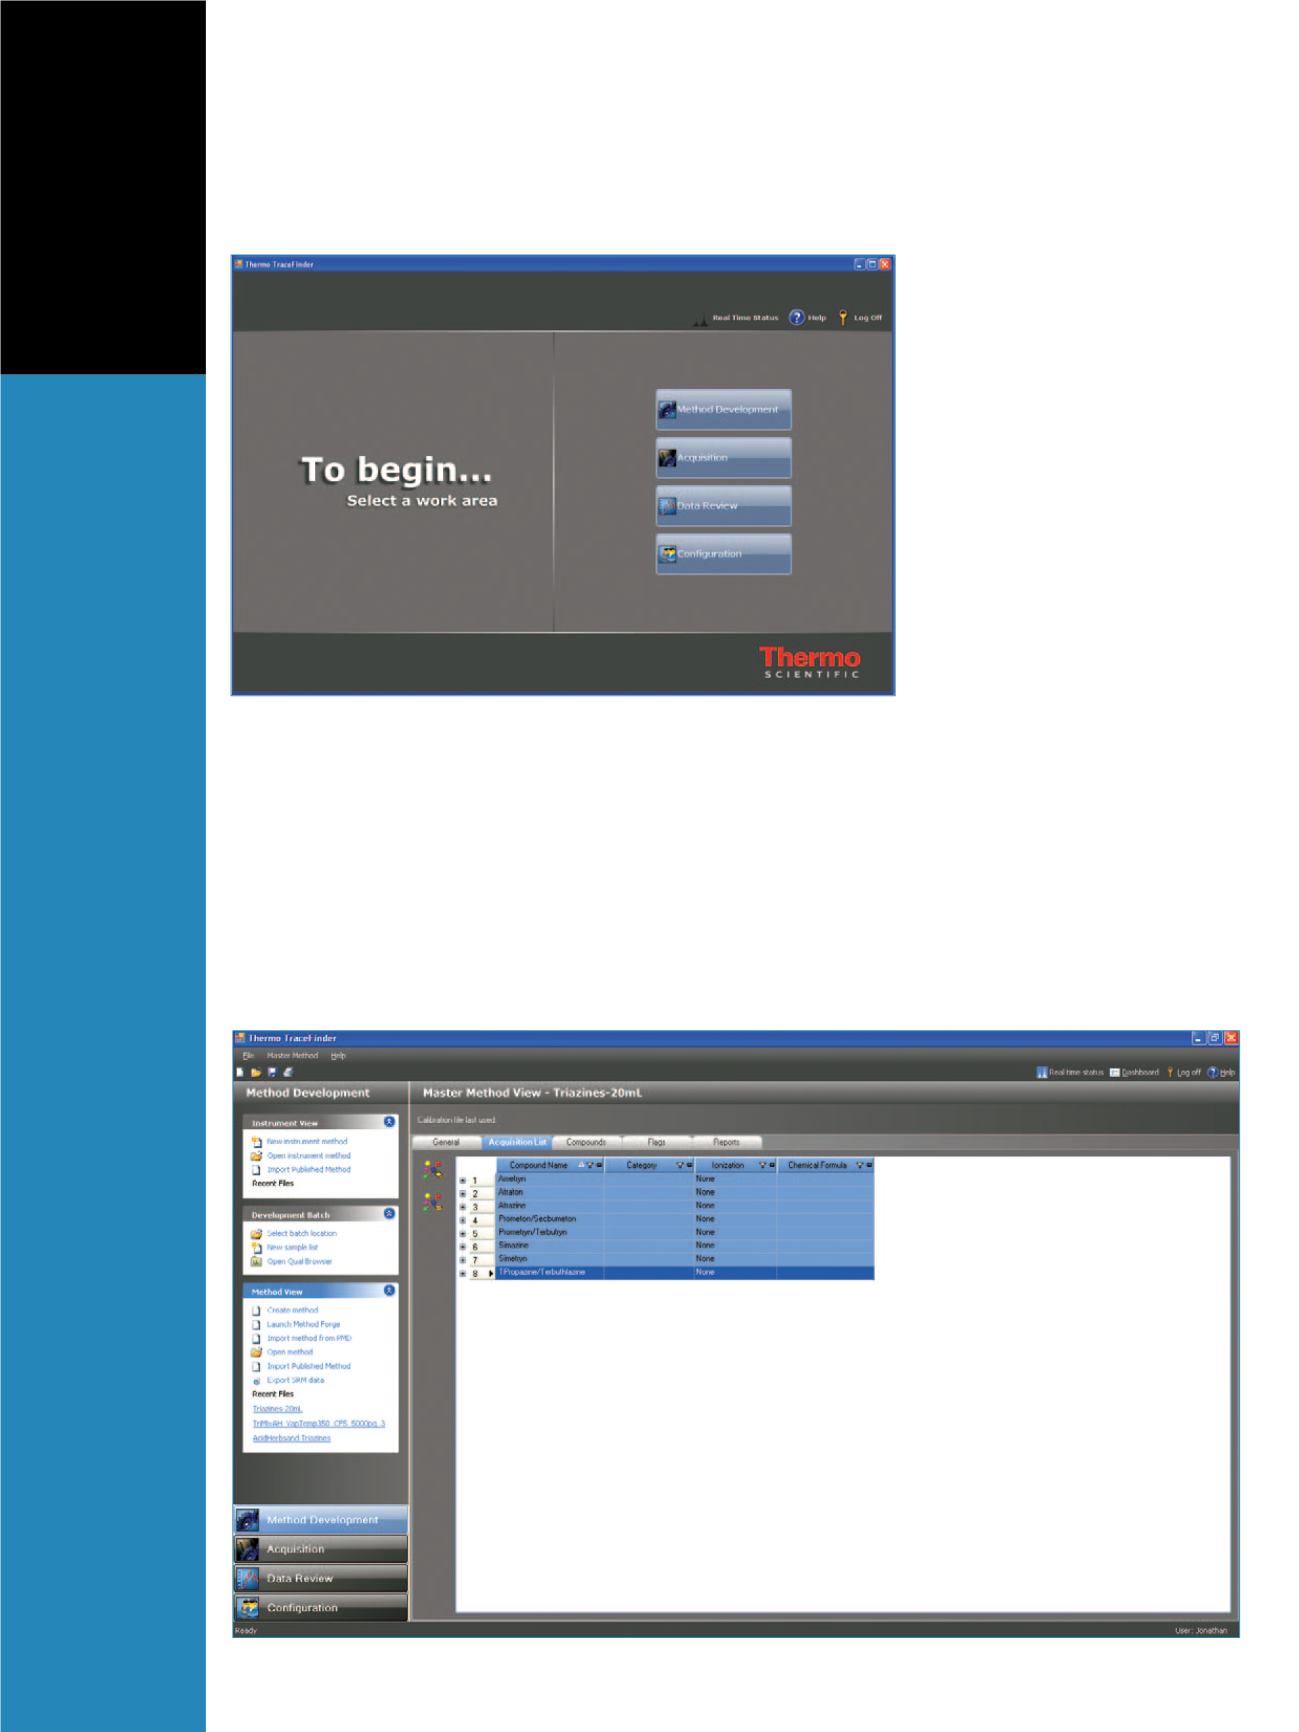
Method Development
The Method Development section of the software allows
the user to select the compounds that will be analyzed in
the method. In this experiment, the appropriate SRM
transitions for the triazine mixture were chosen from the
CDS and inserted into the method for detection (Figure 2).
No compound optimization is necessary for compounds
already in the data store.
Additionally, the calibration standards, QC levels, and
peak detection settings are defined in the Method
Development section. Results can be flagged based on
user-defined criteria. For example, the user can set a flag
for a compound whose calculated concentration is beyond
the upper limit of linearity, above a
defined reporting limit, or below a
limit of detection. This allows for
faster data review after collection,
and quick identification of positive
samples. Full support for qualifier
SRM ion ratios is also included but
was not used in this experiment.
Acquisition
The Acquisition section provides a
step-by-step process to acquire data.
The progress is followed in an
overview section on the left side of
the screen (Figure 3). A green
checkbox indicates that the step has
been completed and there are no
errors. The steps include template
selection (pre-defined sample lists,
which are helpful in routine analysis),
method selection, sample list
definition, report selection, and instrument status. Figure
3 shows calibrators, blanks, replicate “unknowns” of a
1 pg/mL sample, and drinking water samples for this
experiment.
A final status page summarizes the method and all of
the samples to be run and gives an overall summary of the
status of the instrument (Figure 4). Three color-coded dots
are shown: green indicates an ‘ok’ status; yellow indicates
the instrument module is in standby; and red indicates the
Figure 1. TraceFinder Welcome screen
Figure 2. Master Method View, showing the triazine compounds that will be monitored in this method.