


 35 / 302

Reporting
A large number of customizable report templates are
included in TraceFinder. The user has the option of
creating PDF reports, printing reports directly to the
printer, or saving reports in an XML format, which is
useful for LIMS systems. In each method, the user can
decide which reports are most applicable to a given
method. In this manner, a supervisor or lab director can
set up methods and reports, lock the method, and make it
non-editable by technicians. In this way, the integrity of a
method is preserved, which is especially useful in
controlled environments.
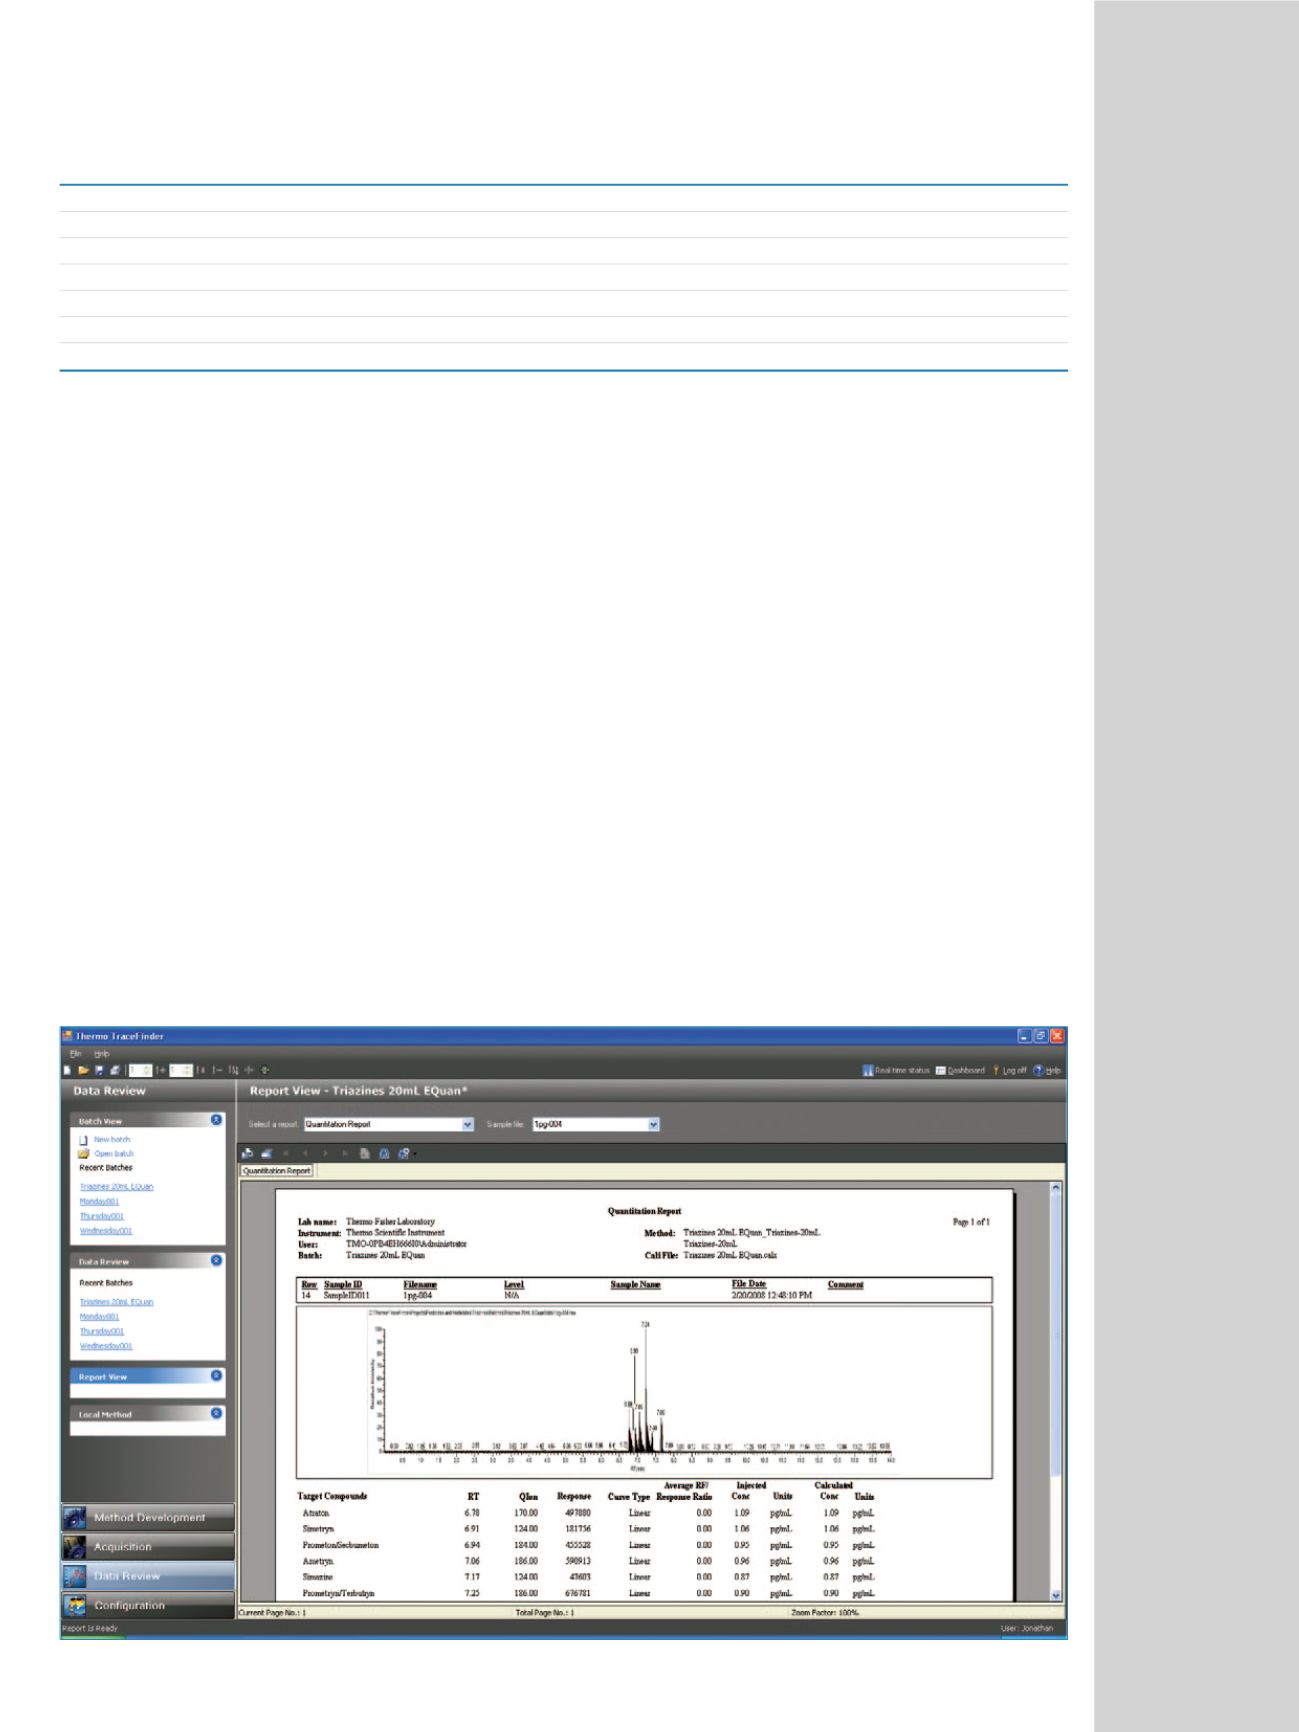
An example of one of the reports generated by
TraceFinder is shown in Figure 6. This view shows the on-
screen preview function available in TraceFinder. The
chromatogram shown is for a 1 pg/mL “unknown” spiked
water sample. The quantitated results follow beneath the
chromatogram. At the very top of the page is a sample
summary. TraceFinder can generate results for the entire
batch with the click of a button, or the user can choose to
view reports individually and print only those of interest.
Conclusion
In this application note, TraceFinder software was used in
conjunction with an online preconcentration system,
Equan
™
, for the robust and reproducible analysis of large
volumes of drinking water. Triazines were quantitated at
the sub-ppt level, and several commercial bottled drinking
water samples and one sugar-free soda sample were
analyzed for the presence of triazines. Only one sample
contained any traces of triazines: a commercial drinking
water sample tested positive for atrazine. TraceFinder can
also be used for traditional LC/MS applications,
minimizing method development time. The method
development capabilities and Compound Datastore of
TraceFinder allowed for the quick creation of a method
for the analysis of these compounds.
Factor
Factor
%RSD
Compound
Area, 1 mL
Area, 5 mL
Area, 20 mL
1 mL to 5 mL
5 mL to 20 mL
(n = 8)
Atraton
ND
1.16E+07
5.42E+07
N/A
4.69
11.15
Simetryn
ND
4.27E+06
1.94E+07
N/A
4.56
8.93
Prometon/Secbumeton
3.26E+06
1.07E+07
4.80E+07
3.30
4.47
9.89
Ametryn
4.34E+06
1.42E+07
5.99E+07
3.27
4.22
11.59
Simazine
3.18E+05
1.28E+06
5.70E+06
4.03
4.44
5.32
Prometryn/Terbutryn
6.19E+06
1.89E+07
7.61E+07
3.05
4.02
3.99
Atrazine
1.26E+06
4.45E+06
1.55E+07
3.53
3.49
4.97
Figure 6. Report View section. In this report preview, the results of a water sample spiked with 1 pg/mL of the triazine mixture are shown.
Table 1. Reproducibility and peak area enhancement for 1, 5, and 20 mL injections for the mixture of triazines at the 1 pg/mL level (n=20).