


 41 / 302

Factor
Factor
%RSD
Compound
Area, 1 mL
Area, 5 mL
Area, 20 mL
1 mL to 5 mL
5 mL to 20 mL
(n = 8)
Atraton
ND
1.16E+07
5.42E+07
N/A
4.69
11.15
Simetryn
ND
4.27E+06
1.94E+07
N/A
4.56
8.93
Prometon/Secbumeton
3.26E+06
1.07E+07
4.80E+07
3.30
4.47
9.89
Ametryn
4.34E+06
1.42E+07
5.99E+07
3.27
4.22
11.59
Simazine
3.18E+05
1.28E+06
5.70E+06
4.03
4.44
5.32
Prometryn/Terbutryn
6.19E+06
1.89E+07
7.61E+07
3.05
4.02
3.99
Atrazine
1.26E+06
4.45E+06
1.55E+07
3.53
3.49
4.97
Table 1: Reproducibility for 20 mL injections (n = 8) at a 1 pg/mL concentration level, without an internal standard.
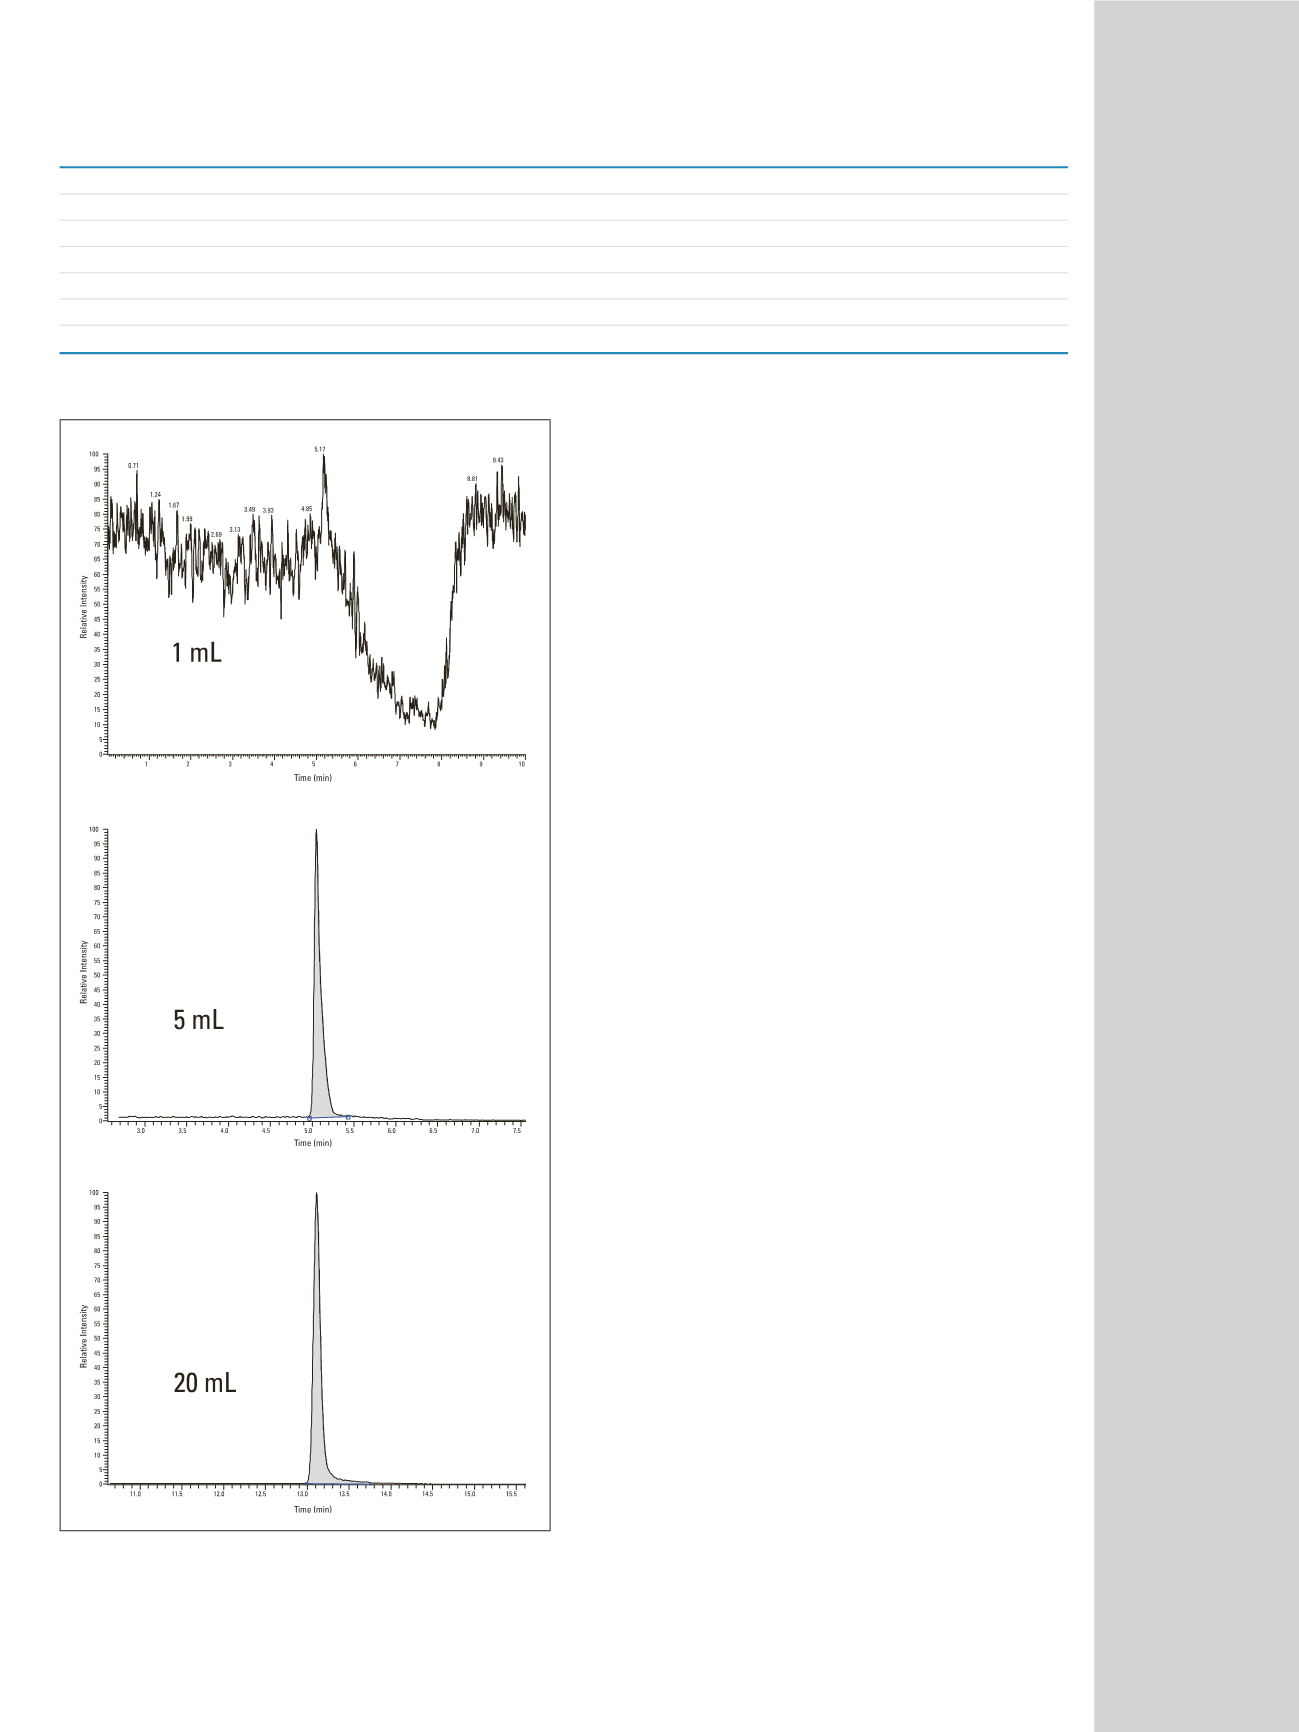
Figure 3: Chromatograms showing the injection of simazine with
1, 5, and 20 mL injection volumes. The concentration of simazine is 1 pg/mL
for all three injections.
In addition to quantitative data, qualitative data was
collected for each analyte using Quantitation-Enhanced
Data-Dependent MS/MS (QED-MS/MS) scanning with the
Reverse Energy Ramp (RER) scan function. The reverse
energy ramp allows the collision energy in Q2 to be
ramped from a high energy to a lower energy as Q3 is
scanning the product ions from Q2 from low mass to high
mass. This provides a rich product ion spectrum that can
be used for library searching or ion ratio calculations to
help eliminate “false positive” results. The RER provides
a much “richer” product ion when compared to a Q3
product ion scan collected with a static collision energy.
For this experiment, the collision energy for the RER was
set to 25 eV and the ramp value was set to 20 eV. This
results in a ramp from 45 eV at the low mass range of
Q3. As Q3 scans to higher masses, the collision energy
in Q2 is ramped lower and ends at a collision energy of
25 eV. Figure 4 shows the full scan Q3 spectrum that
was collected during the analytical run for the calibration
standard at a level of 1 pg/mL. It also shows a ramp
illustrating the collision energy ramp applied to Q2.