


 40 / 302

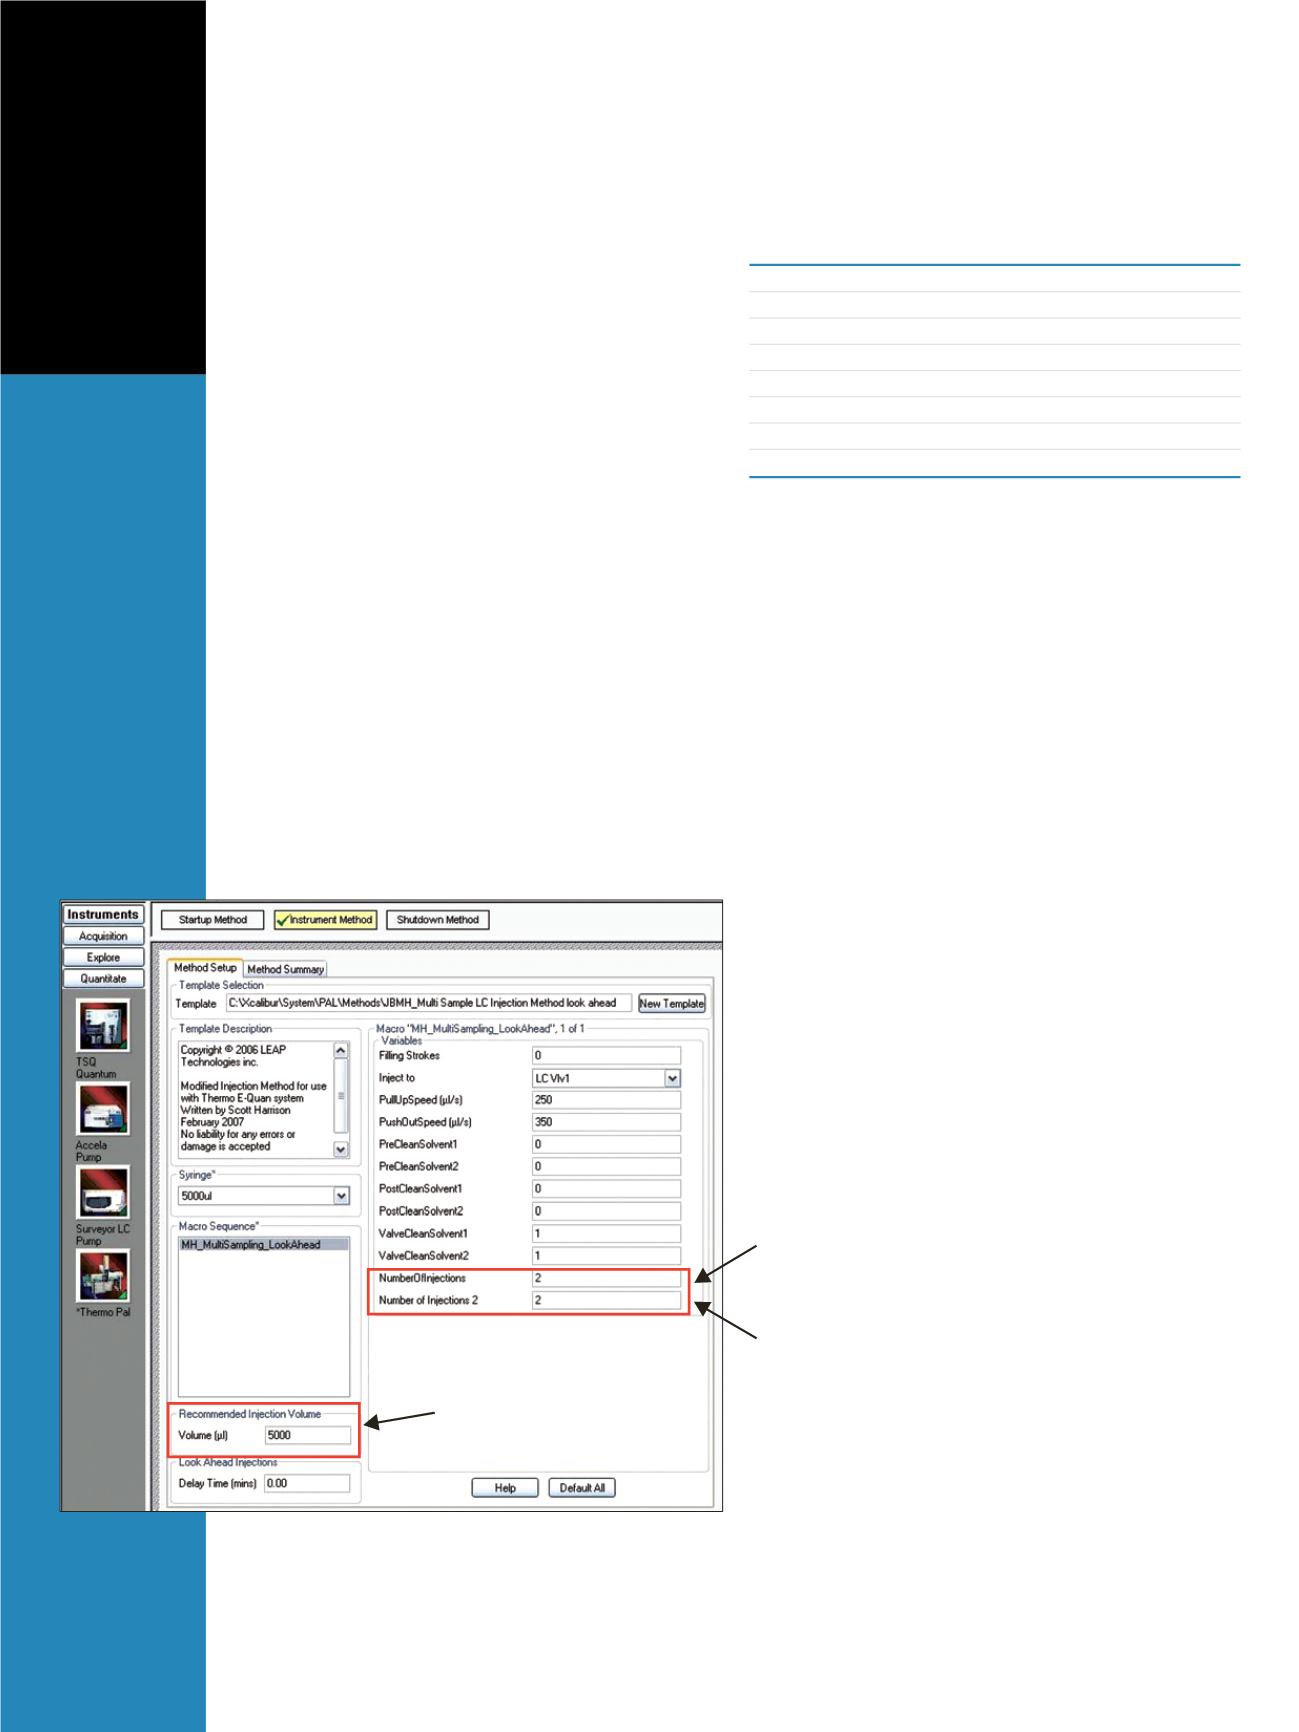
Figure 2: The method setup screen for the CTC Autosampler, showing the
capability to perform multiple injections from the same vial. The red box
highlights the parameters used to control the number of syringe fills from
two consecutive vials. In this example, a total of 20 mL will be injected.
Slightly different LC programs were used in each
method, depending on the volume of the sample injected.
The loading pump flow rates ranged from 1 mL/min for
1 mL samples to 5 mL/min for 20 mL samples. This allowed
the run times at the higher injection volumes to be shortened
because the time to transfer the sample from the sample
loop to the loading column depends on the flow rate. The
same LC program was used for the analytical column.
Two HPLC pumps were used for the analysis: one for
transferring the sample from the injection loop to the
loading column, and one for back flushing the compounds
off of the loading column and separating them on the
analytical column. The loading pump was a Surveyor Plus
™
LC pump (Thermo Fisher Scientific, San Jose, CA) and the
analytical pump was a U-HPLC Accela
™
pump (Thermo
Fisher Scientific, San Jose, CA).
The HTC autosampler was equipped with a 5 mL
syringe. To accommodate larger injection volumes (> 5 mL),
a CTC
™
macro sequence was programmed to allow for
multiple syringe fills and deliveries to the sample loop
from a 10 mL vial. For 20 mL samples, two 10 mL vials
were used and the macro allowed sampling from adjacent
vials filled with the same sample. The macro is shown in
Figure 2. Because this multi-sampling scheme can be quite
time consuming, the ability to perform “look-ahead”
injections allows for significant time savings. The loop
can be switched to an offline position during a run, and
subsequent samples can be prepared and injected while a
sample is being run.
MS
MS analysis was carried out on a TSQ Quantum Access
™
triple stage quadrupole mass spectrometer with an
electrospray ionization (ESI) source (Thermo Scientific,
San Jose, CA). The MS conditions were as follows:
Ion Source Polarity:
Positive ion mode
Spray Voltage:
4000 V
Ion Transfer Tube Temperature:
300 °C
Sheath Gas Pressure:
30 arbitrary units
Auxiliary Gas Pressure:
5 arbitrary units
Collision Gas (Ar):
1.5 mTorr
Q1/Q3 Peak Resolution:
0.7 Da
Scan Width:
0.002 Da
Quantitative and qualitative data were collected in the
same run and data file.
Results and Discussion
Chromatograms of the herbicide simazine at three different
injection volumes are shown in Figure 3. A very small peak
can be seen for the 1 mL injection volume; however, the
integration is not shown in the chromatogram. Injections
at higher volumes show superior signal-to-noise ratios and
intensity, which allow for analysis of very low concentration
samples (pg/mL and sub pg/mL). To test the reproducibility
of the multiple syringe fill method with a 20 mL loop,
eight replicate injections were performed using the 1 pg/mL
calibration standard. The results of this study are shown
in Table 1. No internal standard was used in this analysis;
however, if one were to be included, the % Relative
Standard Deviations (RSD) values would likely improve.
Table 1 also shows the peak areas and calculated difference
in peak areas between the 1, 5, and 20 mL injections.
FPO
Volume to be pulled
per syringe “injection”
Number of syringe
fills from the first vial.
Number of syringe fills
from the second vial (optional).