


 47 / 302

Reproducibility, Linearity, and Detection Limits
Method precision using UV detection was estimated
by making five consecutive 1000 µL injections of a
calibration standard, each with a concentration of
100 µg/L. The reproducibilities of retention time and peak
area relative standard deviation (RSD) are summarized
in Table 3.
Calibration linearity for UV detection of paraquat and
diquat was investigated by making three consecutive
1000 µL injections of a mixed standard prepared at six
different concentrations (i.e., 18 total injections). The
external standard method was used to establish the
calibration curve and to quantify paraquat and diquat in
the drinking and environmental water samples. Excellent
linearity was observed from 1 to 1000 µg/L when plotting
the concentration versus peak area, and the coefficients
of determination were all
≥
0.99097 (Table 4).
The MDLs of all compounds subjected to UV detection
were calculated using the equation:
Detection Limit = S
t
(n – 1, 1 -
α
= 0.99)
The symbol S represents standard deviation of replicate
analyses, n represents number of replicates,
t
(n – 1, 1 -
α
= 0.99)
represents Student’s
t
value for the 99% confidence level
with n – 1 degrees of freedom. Five replicate injections
of reagent water spiked with 100 µg/L of paraquat and
diquat standard mixture were used to determine the
MDLs. Table 4 summarizes the MDL data, which show
excellent method sensitivity with detection limits
equivalent to those defined in EPA Method 549.2 and
which meet the restriction in 98/83/EC.
Tap Water and Environmental Water Analysis
Figures 5 and 6 show chromatograms of a tap water
sample and a pond water sample. No target analytes
were found. The analysis results and related data are
summarized in Table 5, demonstrating that this on-line
SPE HPLC method provides good selectivity and
suitability for the determination of paraquat and diquat
in water samples.
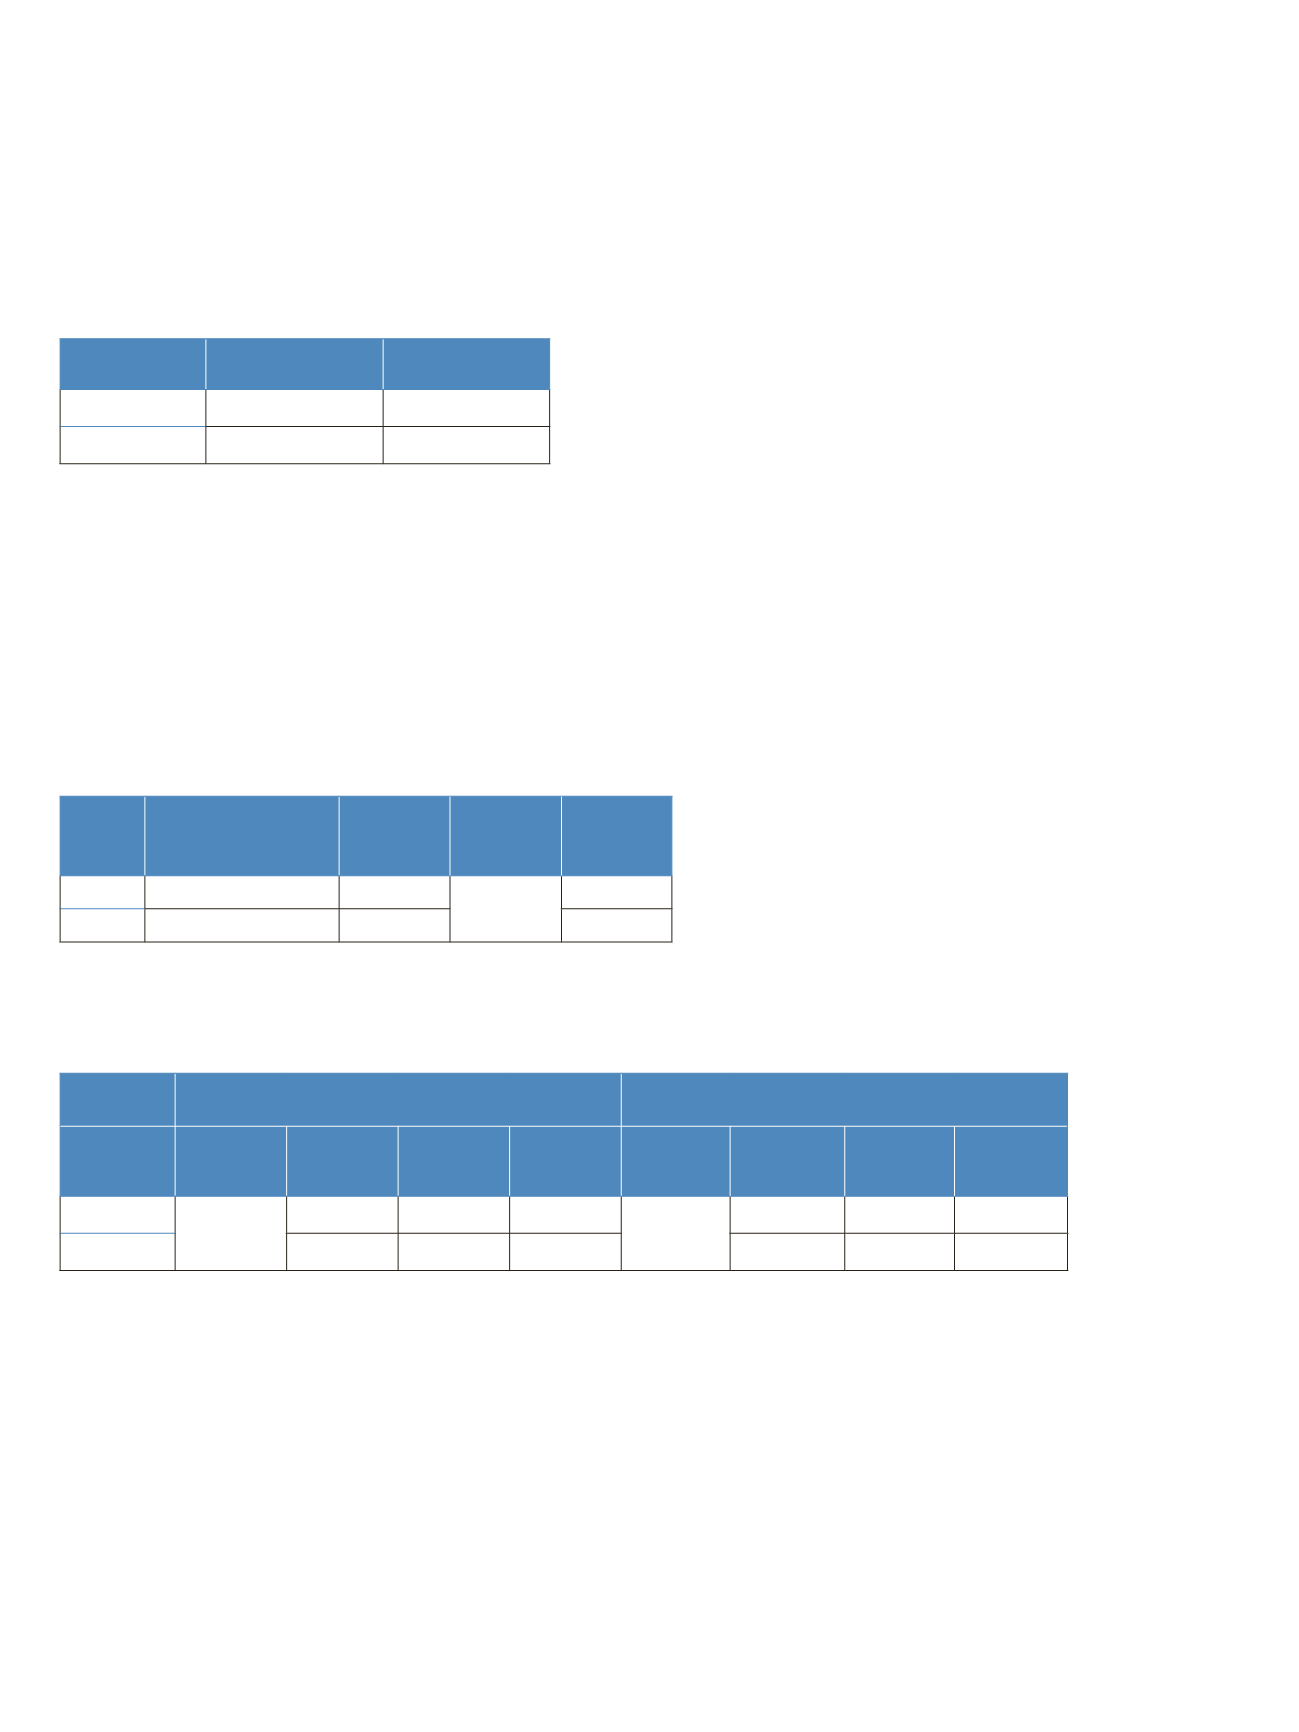
5
Analyte
Retention Time RSD Peak Area RSD
Paraquat
0.18
4.85
Diquat
0.15
4.69
Table 3. Reproducibility of peak retention time and area.
Analyte Regression Equation
r
2
Range of
Standards
(µg/L)
MDL*
(µg/L)
Paraquat
A
= 0.1968
c
– 1.0993 0.99996
1–1000
0.09
Diquat
A
= 0.1557
c
– 2.0420 0.99709
0.10
Table 4. Method linearity data and MDLs.
Sample
Tap Water
Pond Water
Analyte
Detected
(µg/L)
Added
(µg/L)
Found
(µg/L)
Recovery
(%)
Detected
(µg/L)
Added
(µg/L)
Found
(µg/L)
Recovery
(%)
Paraquat
Not
Detected
100
105
105
Not
Detected
100
104
104
Diquat
100
108
108
100
105
105
Table 5. Analysis results of spiked water samples.
* The single-sided Student’s
t
test method (at the 99% confidence limit) was used for determining MDL,
where the standard deviation of the peak area of five injections was multiplied by 4.6 to yield the MDL.