


 48 / 302

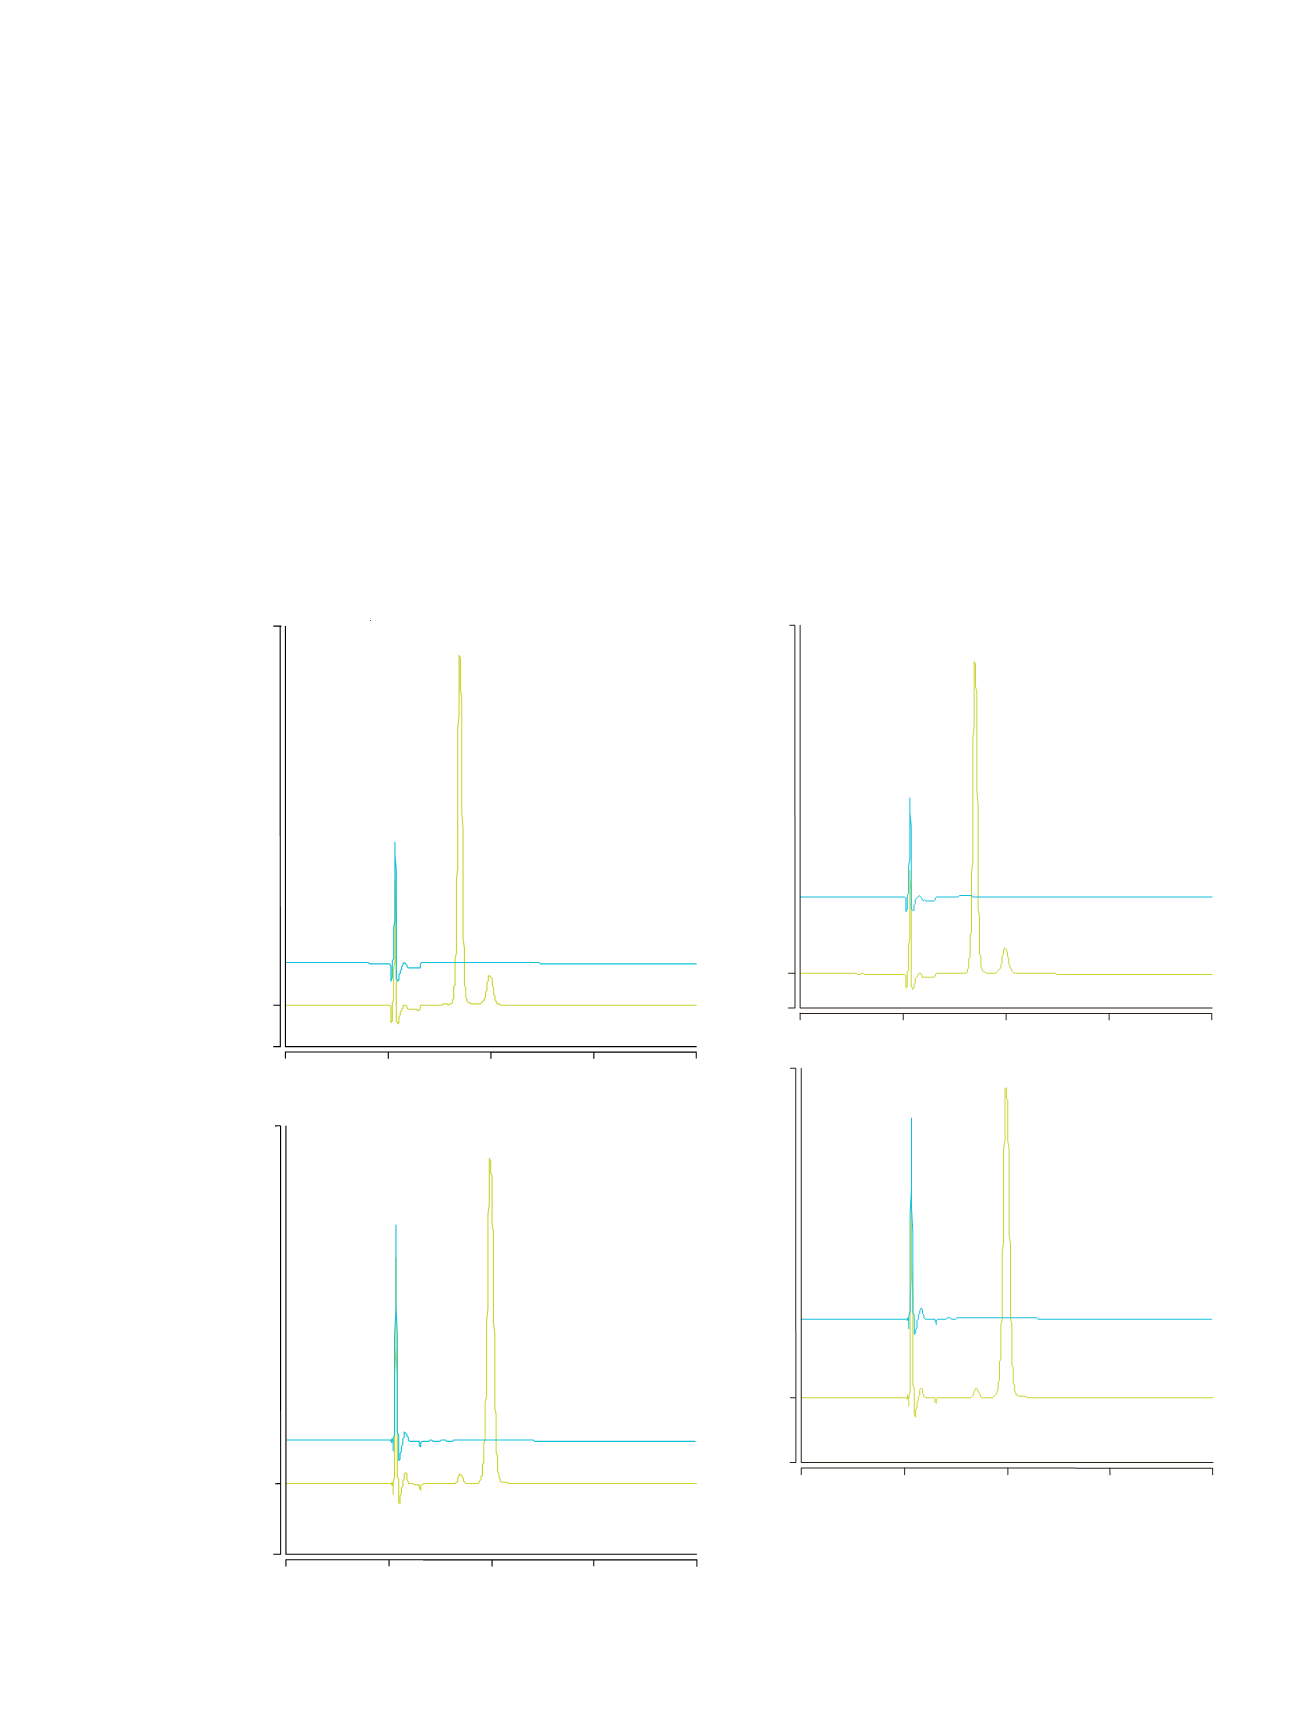
Figure 6. Chromatograms of a pond water sample and the same sample
spiked with a paraquat and diquat standard at (A) 260 nm and (B) 310 nm.
For On-Line SPE
Column:
Acclaim Trinity P1, 3 µm, Guard Cartridges (3.0 × 10 mm)
with V-2 Holder
Mobile Phase: A: 100 mM Ammonium Acetate (pH 5.0)
B: Acetonitrile
C: H
2
O
Gradient:
0–2 min, 10% A, 5% B
2.1–4.5 min, 55% A, 45% B
4.6–10 min, 10% A, 5% B
Flow Rate:
0.7 mL/min
Inj. Volume:
1000 µL onto the on-line SPE cartridge
For Separation
Column:
Acclaim Trinity Q1, 3 µm, Analytical (3.0 × 50 mm)
Mobile Phase: 35% 100 mM Ammonium Acetate (pH 5.0)/65% Acetonitrile
Flow Rate:
0.5 mL/min
Temperature:
30 °C
Detection:
UV absorbance at (A) 260 nm for paraquat and
(B) 310 nm for diquat
Valve Position: 0 min, 1_2
2.0 min, 6_1
4.5 min, 1_2
Samples:
(a) A pond water sample
(b) The same sample spiked with a paraquat and
diquat standard (100 µg/L each)
Peaks: 1. Paraquat
2. Diquat
0.0
2.5
5.0
7.5
10.0
-20
0
200
mAU
b
a
1
2
A
0.0
2.5
5.0
7.5
10.0
-20
0
100
mAU
b
a
2
1
B
Minutes
Minutes
6
Figure 5. Chromatograms of a tap water sample and the same sample spiked
with a paraquat and diquat standard at (A) 260 nm and (B) 310.
For On-Line SPE
Column:
Acclaim Trinity P1, 3 µm, Guard Cartridges (3.0 × 10 mm)
with V-2 Holder
Mobile Phase: A: 100 mM Ammonium Acetate (pH 5.0)
B: Acetonitrile
C: H
2
O
Gradient:
0–2 min, 10% A, 5% B
2.1–4.5 min, 55% A, 45% B
4.6–10 min, 10% A, 5% B
Flow Rate:
0.7 mL/min
Inj. Volume:
1000 µL onto the on-line SPE cartridge
For Separation
Column:
Acclaim Trinity Q1, 3 µm, Analytical (3.0 × 50 mm)
Mobile Phase: 35% 100 mM Ammonium Acetate (pH 5.0)/65% Acetonitrile
Flow Rate:
0.5 mL/min
Temperature:
30 °C
Detection:
UV absorbance at (A) 260 nm for paraquat and
(B) 310 nm for diquat
Valve Position: 0 min, 1_2
2.0 min, 6_1
4.5 min, 1_2
Samples:
(a) Tap water sample
(b) The same sample spiked with a paraquat and diquat
standard (100 µg/L each)
Peaks: 1. Paraquat
2. Diquat
0.0
2.5
5.0
7.5
10.0
-20
0
180
Minutes
mAU
0.0
2.5
5.0
7.5
10.0
-20
0
100
Minutes
mAU
a
b
b
a
1
1
2
2
A
B