


 34 / 302

instrument module is either off or disconnected. From the
final status page, the batch can be acquired or saved to be
run at a later date. A previously saved calibration curve
can be used, so that a calibration need not be run every
day. For example, the save function can be used to
prepare for future batches in advance of sample
preparation. When the samples are ready to be run, the
previously saved batch is loaded and acquisition is begun.
Data Review
The targeted analysis of triazine compounds in drinking
water samples was reviewed in the Data Review section of
TraceFinder. In this section, calibration lines, ion ratios,
peak integration, and mass spectra (if applicable) can be
monitored. In addition, the Data Review section can flag
samples that meet certain user-set criteria. For example, a
limit can be set on the R
2
value of a calibration line. A
green flag means that all user-set criteria have been met,
while a red flag indicates that the sample exceeds or fails
some user-set criteria and a yellow flag indicates that the
compound was not found in the sample. Flags can also be
used to highlight “positive” or “negative” hits in a
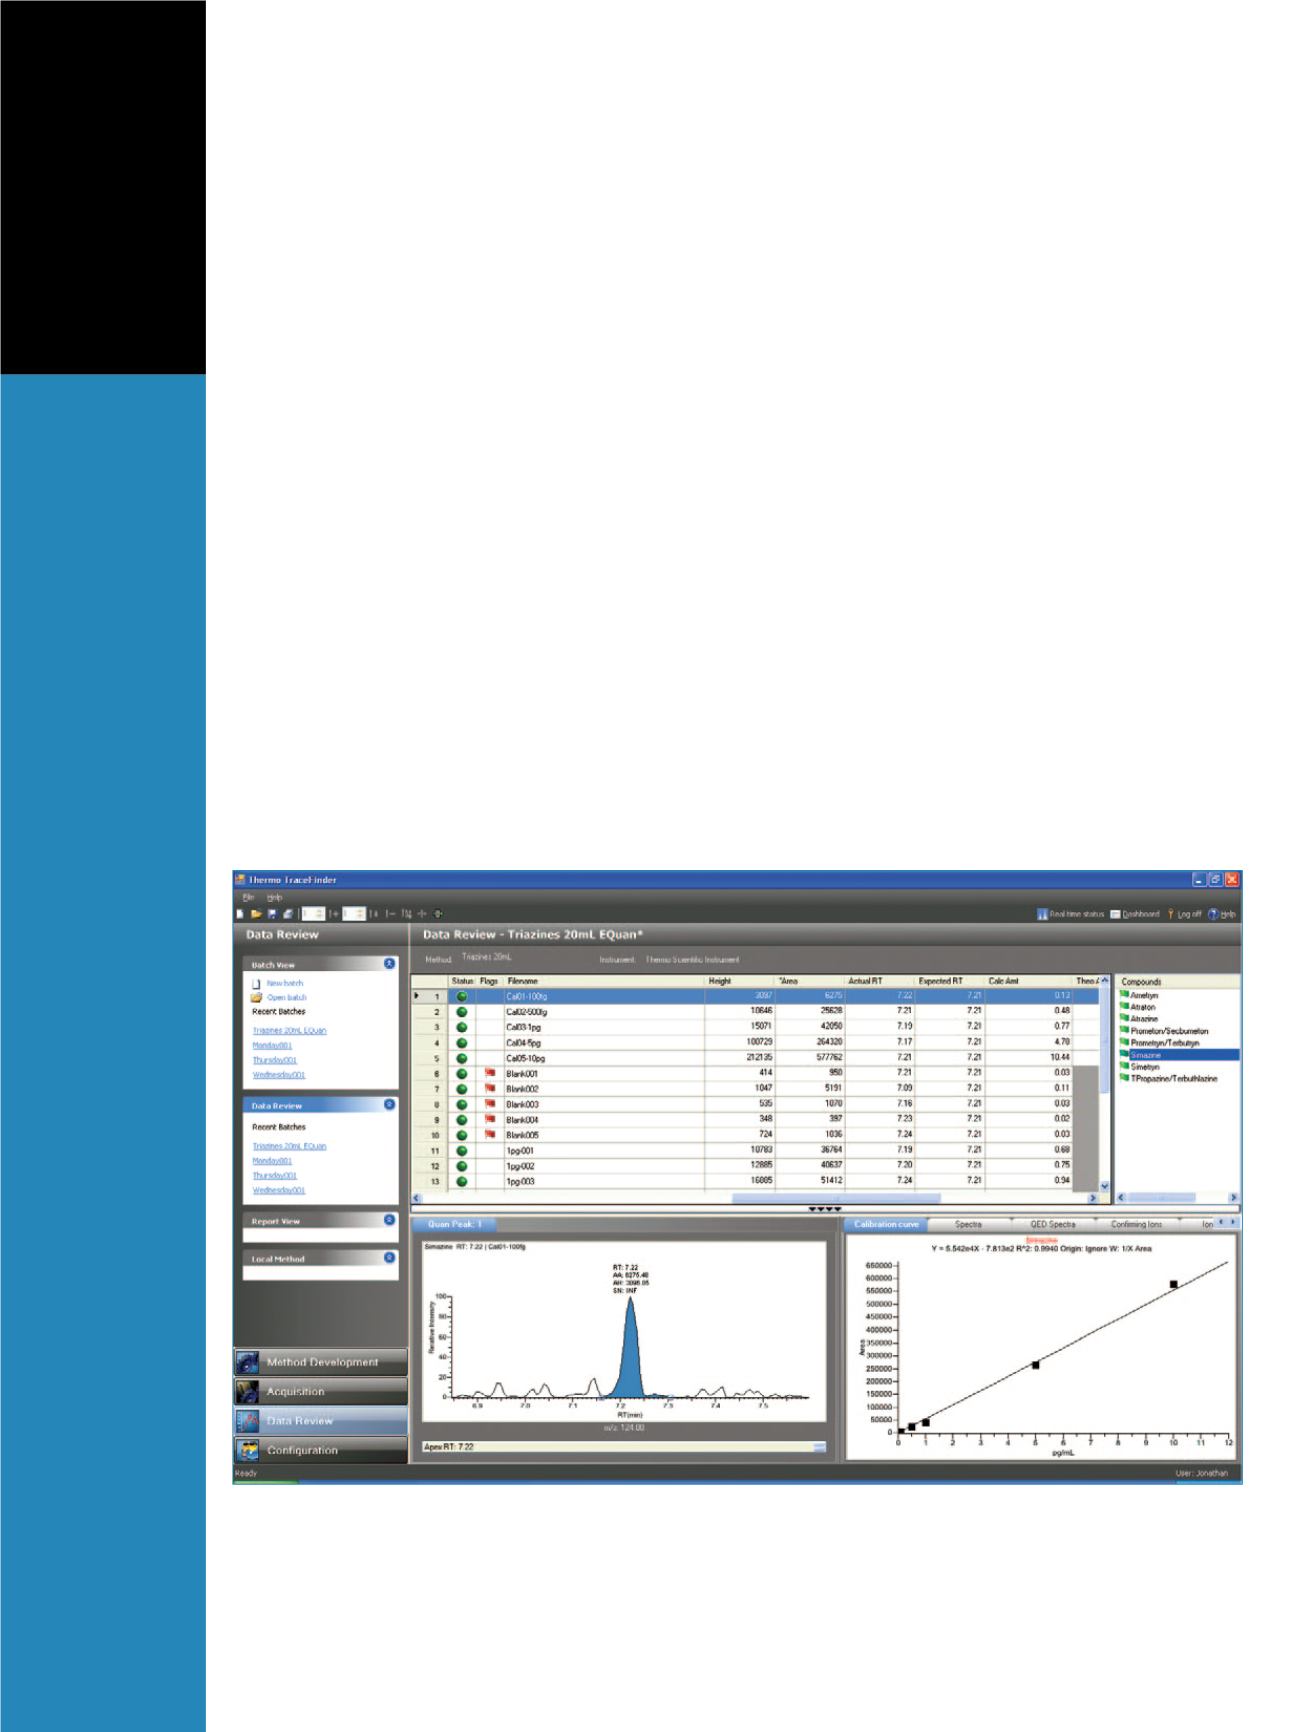
sample. Figure 5 illustrates the red flags indicating the
absence of peaks in blank samples for the compound
simazine at its lowest calibration level, 100 fg/mL. In
addition, flags can be set to alert for the presence of
carryover in blank samples. In this study, 20 mL injections
of the calibration standards, even at the highest level,
resulted in no detectable carryover.
The Data Review pane allows user adjustments, such
as peak reintegration. The effects of the changes on the
results are instantly updated in the results grid. Excellent
linearity was observed for all analytes, with R
2
values
ranging from 0.9921 for atrazine to 0.9995 for propazine
and terbuthlazine (co-eluting isomers, summed together
for this analysis).
As mentioned previously, no carryover was observed
in the blank samples, which illustrates the ability to use a
single loading column for multiple analyses of drinking
water samples. No triazines were detected in the soda
sample, but one of the commercial drinking water samples
tested positive for atrazine. The concentration of atrazine
in the sample was calculated to be 0.24 pg/mL, well below
the regulatory levels in the United States and Europe.
However, using standard injection techniques without
sample preconcentration, it is unlikely that this amount of
atrazine would be detected in a typical LC-MS/MS
analysis of triazines.
In addition to 20 mL injections, 1 mL and 5 mL
injections were analyzed in a separate experiment. The
%RSDs for replicate injections, without internal
standards, at 20 mL are shown with all of the compounds
in Table 1.
Figure 5. Data Review section. The red flags for blank samples indicate that peaks were not found in these samples.