


 24 / 302

6
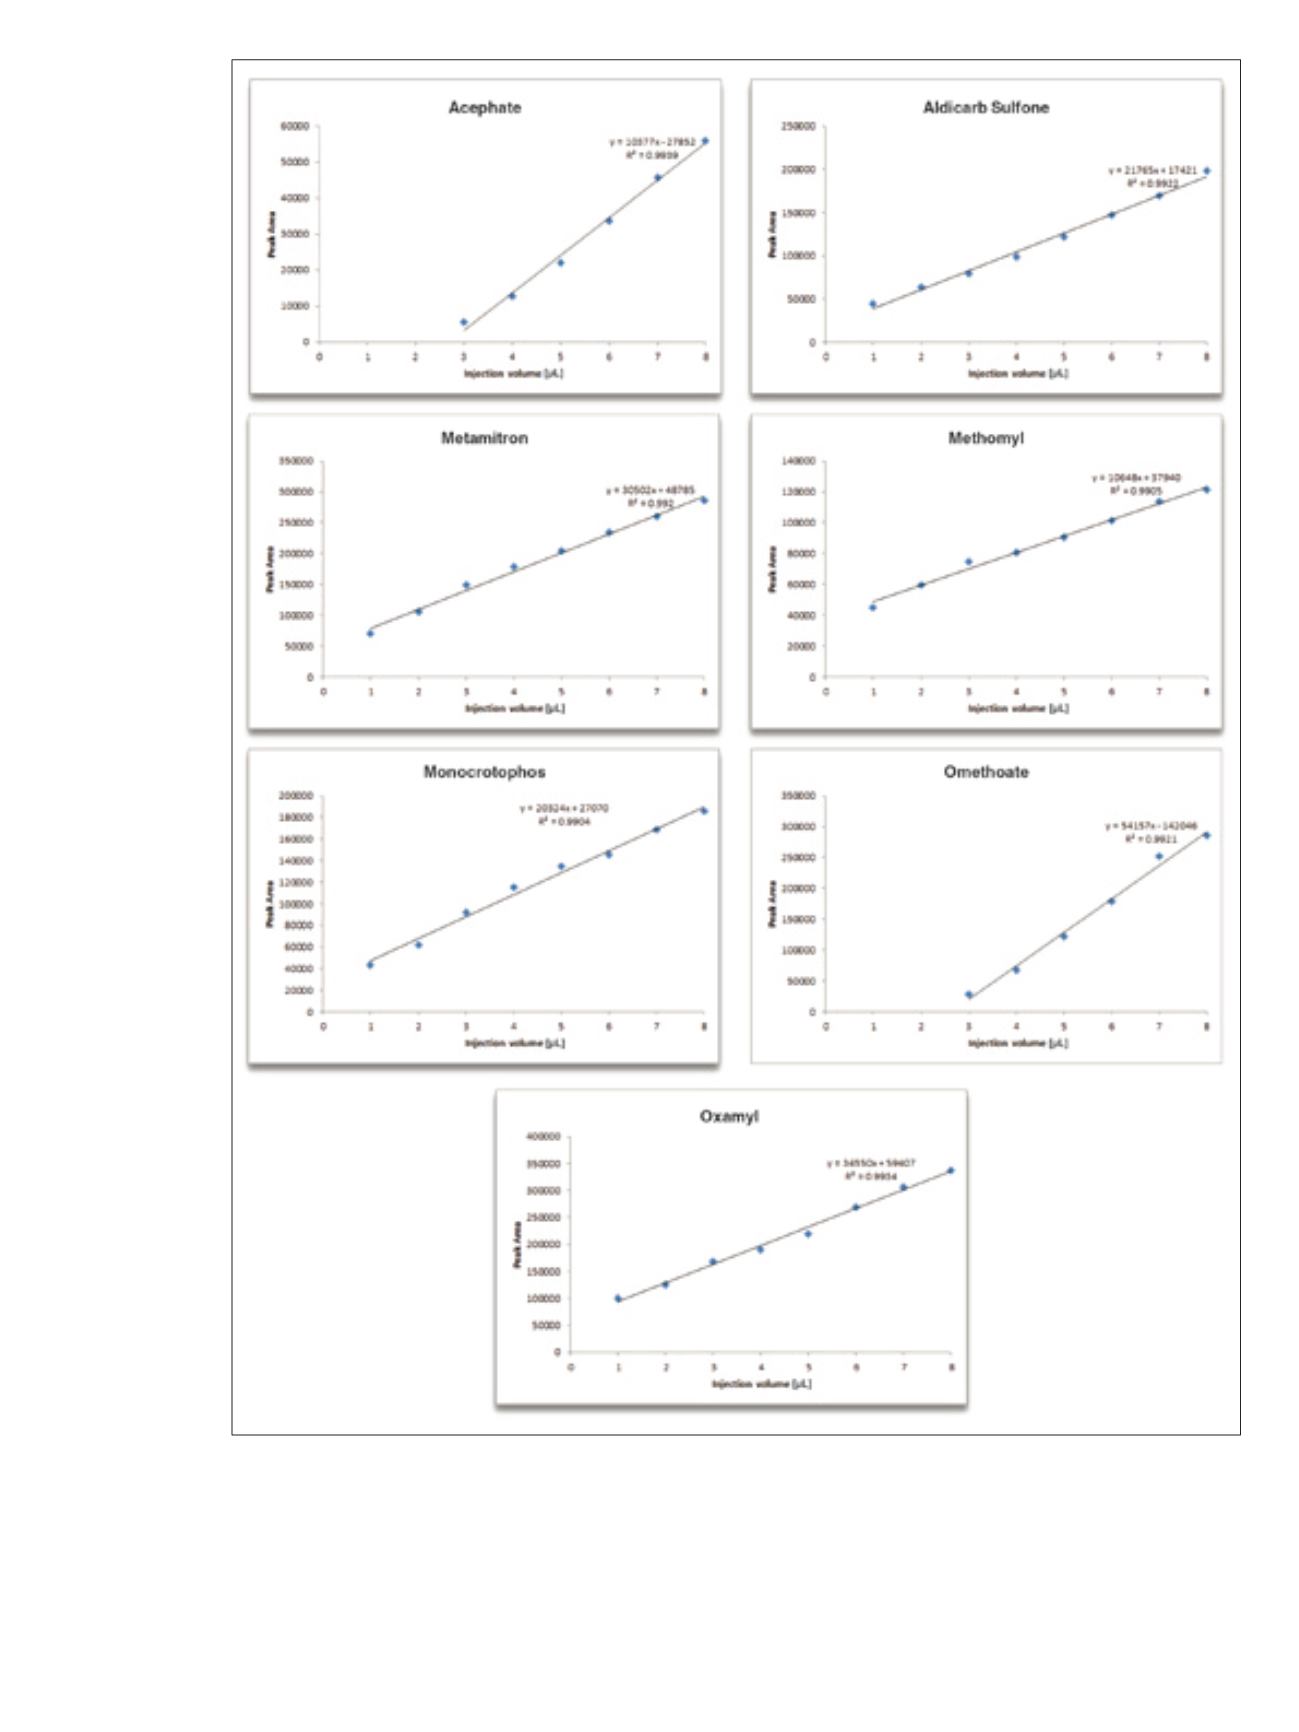
Figure 5. Curves for analyte peak area versus injection volumes 1-8 µL in 10 µg/L acetonitrile solution
 24 / 302
6
Figure 5. Curves for analyte peak area versus injection volumes 1-8 µL in 10 µg/L acetonitrile solution