


 25 / 302

7
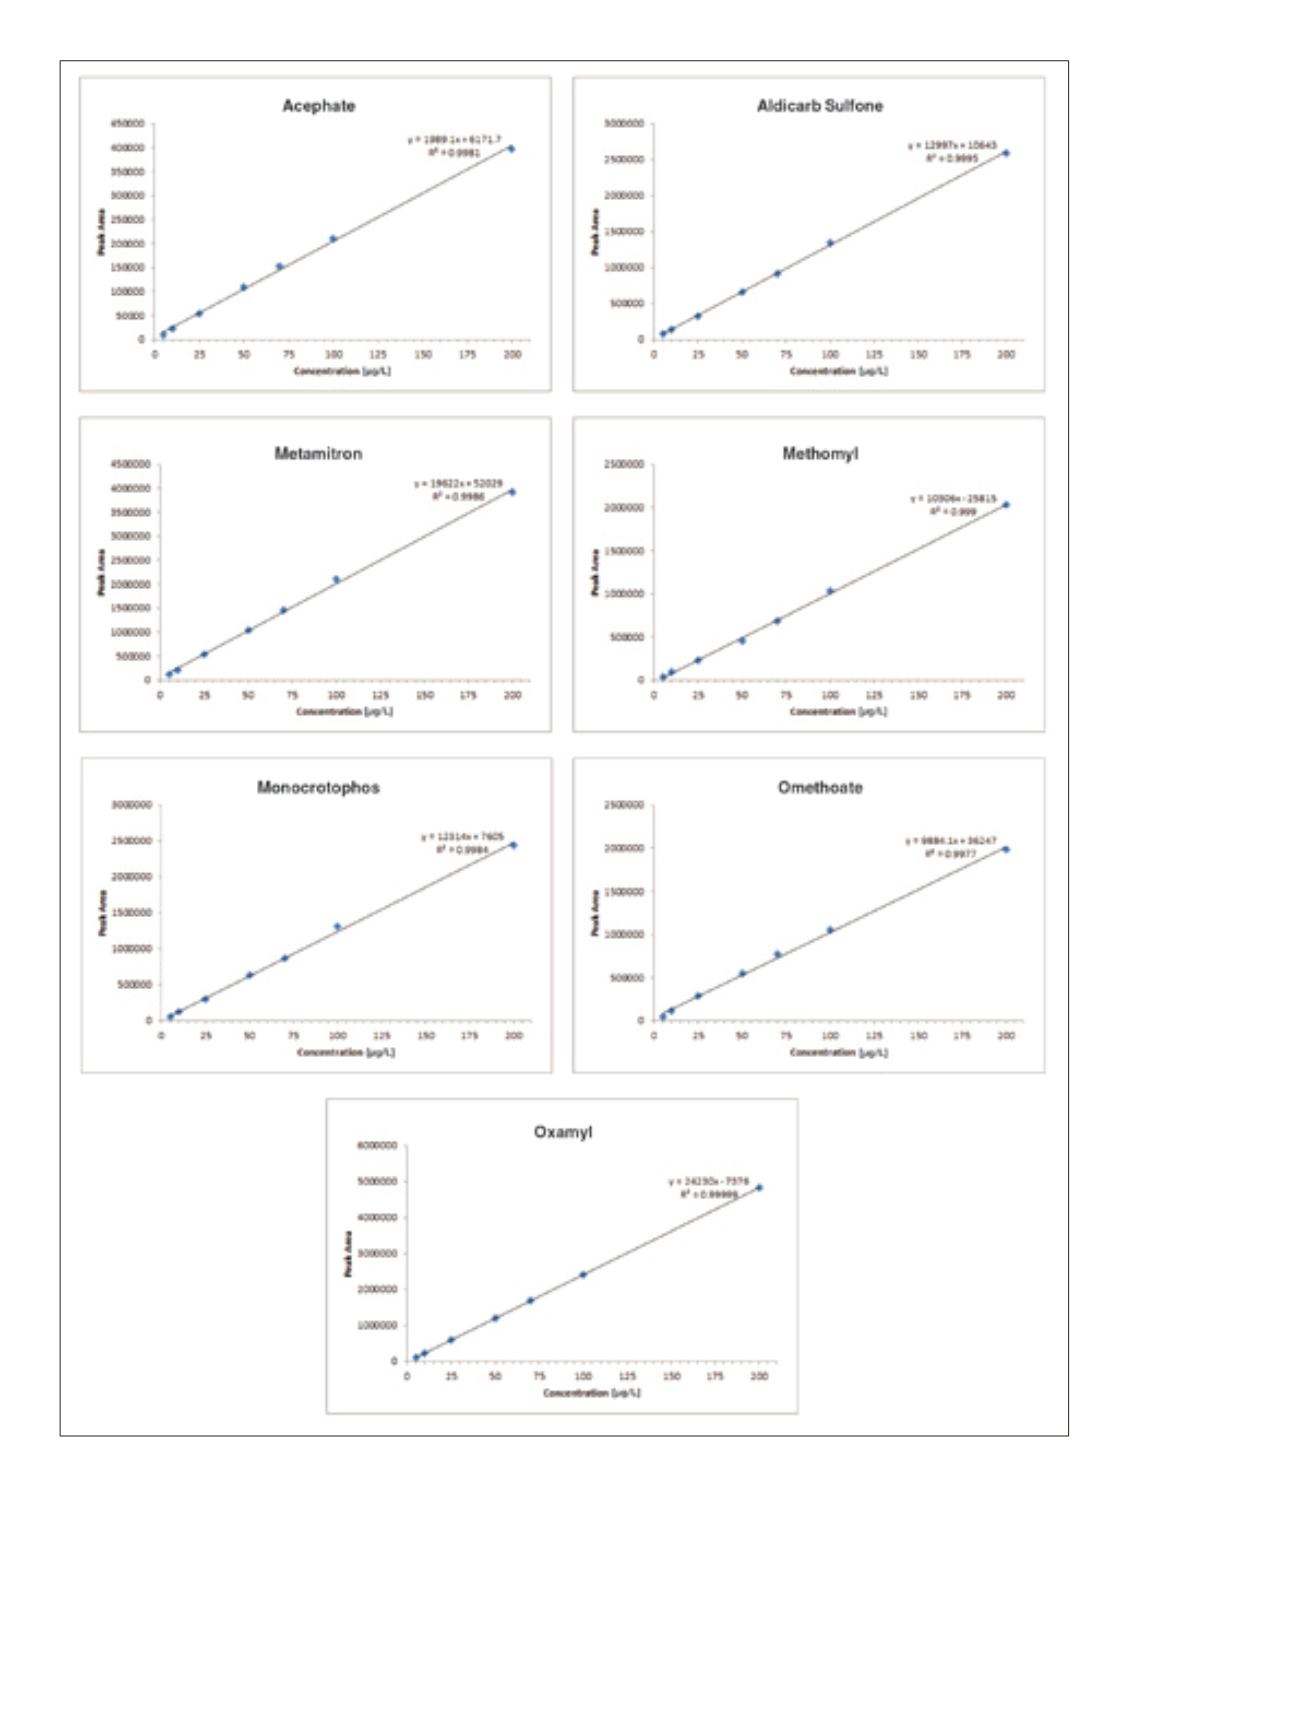
Figure 6. Curves for analyte peak area versus concentration 5-200 µg/L acetonitrile solution with 5 µL injection volume
 25 / 302
7
Figure 6. Curves for analyte peak area versus concentration 5-200 µg/L acetonitrile solution with 5 µL injection volume