


 19 / 302

Analysis of Early Eluting Pesticides in a
C18-Type Column Using a Divert Valve and
LC-MS/MS
Eugene Kokkalis
1
, Anna Rentinioti
1
, Kostas Tsarhopoulos
2
, Frans Schoutsen
3
1
Engene SA, Athens, Greece;
2
RigasLabs SA, Thessaloniki, Greece;
3
Thermo Fisher Scientific, Breda,
The Netherlands
Application Note
572
Key Words
TSQ Quantum Access MAX, Divert Valve, Split Peaks, Reversed-Phase
Liquid Chromatography, Pesticides
Goal
To demonstrate the ability to override the solvent effects from a sample
extract using gradient solvents with liquid chromatography. Additionally, to
increase injection volume without overloading the column.
Introduction
Many pesticide analyses are based on the QuEChERS
extraction method, which uses acetonitrile (ACN) in the
final extraction step. However, injecting a solvent stronger
than the HPLC mobile phase can cause peak shape problems,
such as peak splitting or broadening, especially for the
early eluting analytes (low capacity factor, k). The
common practice is to exchange the solvent of the final
extraction step for one similar to the mobile phase, for
example methanol / water, but this procedure is laborious
and can lead to analyte losses.
There are several possible causes of peak splitting or
broadening. This study presents the peak shape differences
between acetonitrile and methanol / water [1:1 v/v]
solutions due to the interaction of gradient and sample
solvent, as indicated in Figure 1. The lowest detection
limit is achieved when an analyte is in as compact a band
as possible within the flow stream of mobile phase and
with larger injection volumes. However, this is limited by
maximum loop volume and column capacity.
Mobile phase composition and the use of a divert valve
have been evaluated for the analysis of seven selected
pesticides in acetonitrile solutions (Table 1). The sample
solutions were chosen to represent both low and high
analyte levels for compounds that elute either early or
middle-early from a C18 column. Performance was
evaluated in terms of linearity (injection volume range
1–8 µL), robustness (RSD), and sensitivity as measured by
signal-to-noise ratio (S/N) and peak area reproducibility.
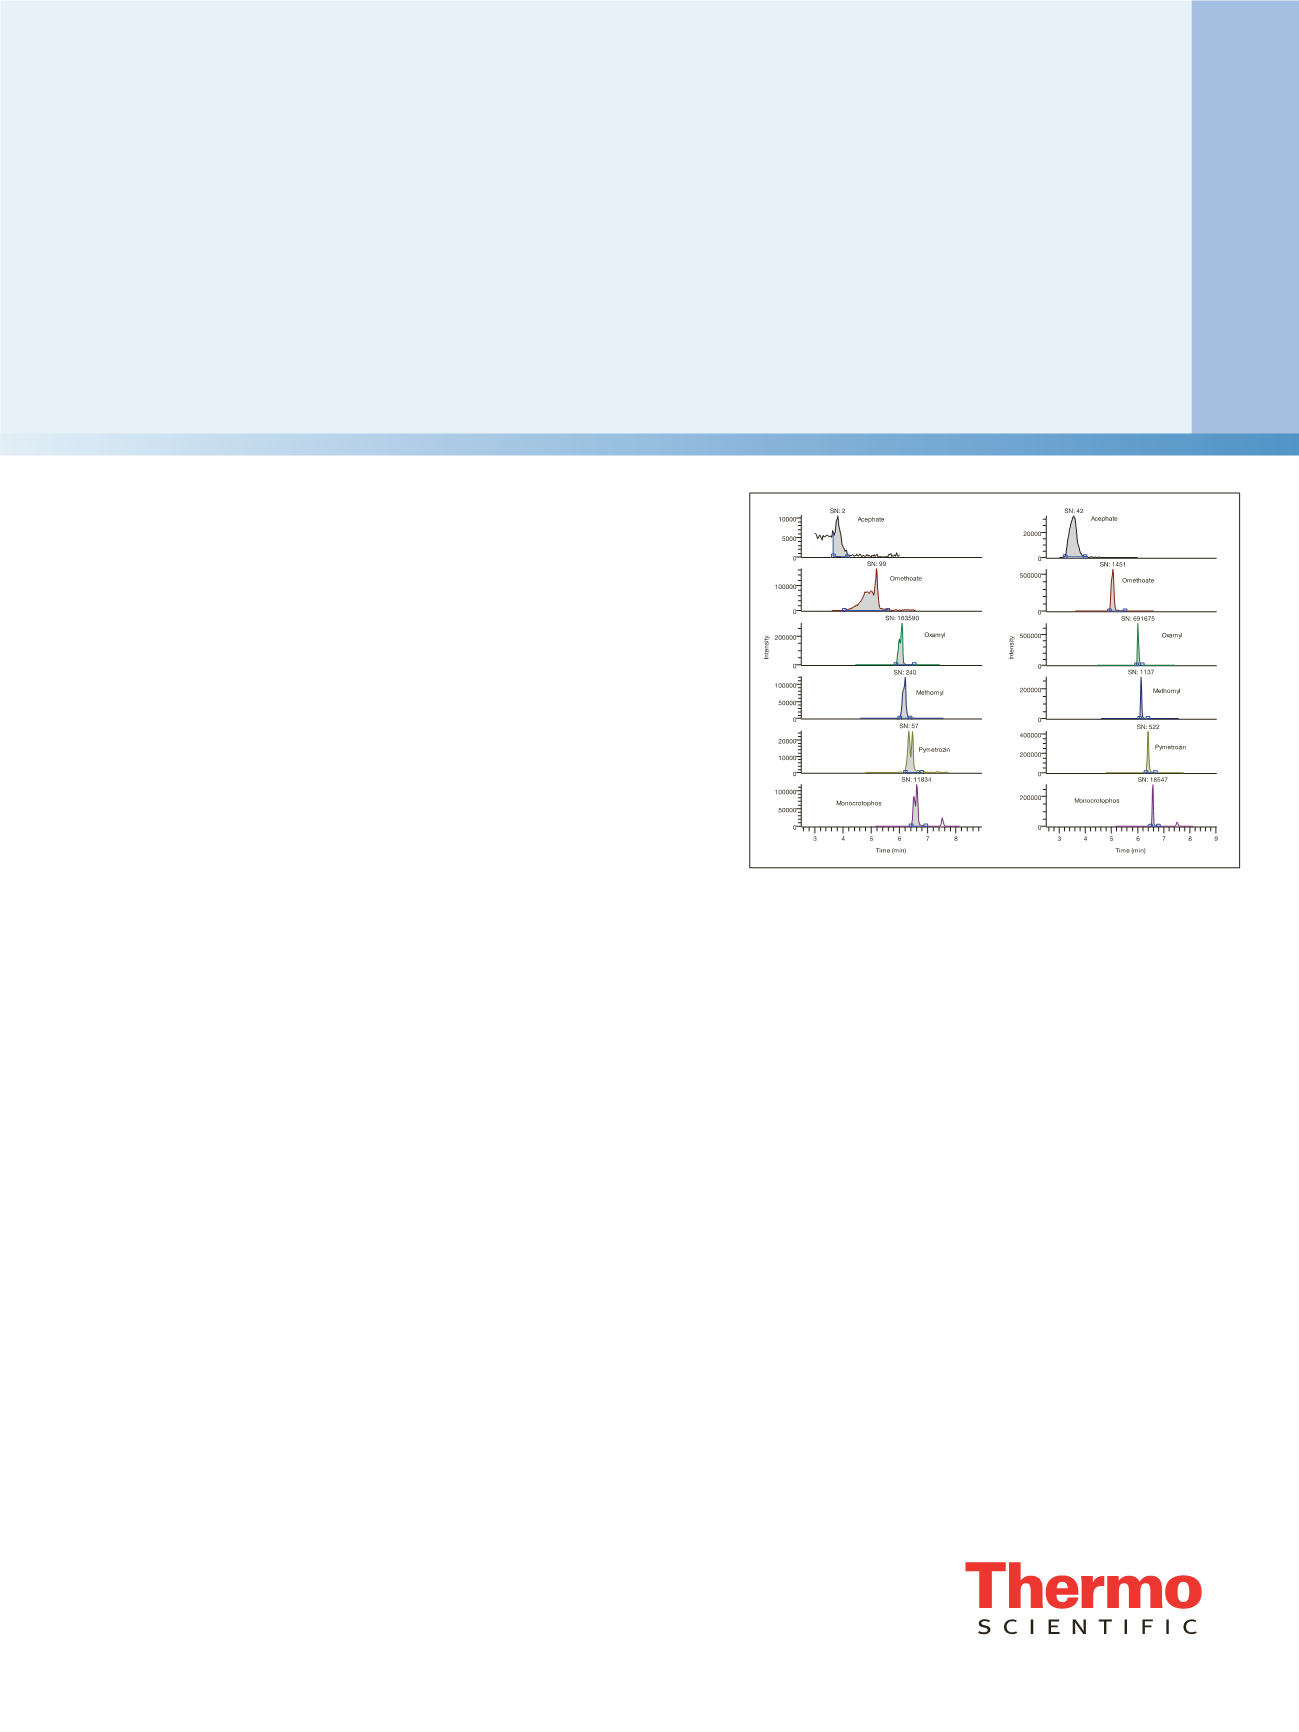
Figure 1. Chromatograms of 5 µL injections of acephate,
omethoate, oxamyl, methomyl, pymetrozin, and monocrotophos
in 50 µg/L acetonitrile (A) and methanol / water [1:1 v/v] solution
(B), with no divert valve used
A
B