


 16 / 302

Mass Spectrometry
All experiments were performed on an Exactive™
benchtop LC-MS powered by Thermo Scientific Orbitrap
technology using a heated electrospray ionization source
(HESI-II). The mass spectrometer was operated in
positive/negative switching mode with a full-scan setting.
MS parameter settings:
Spray voltage:
4100 V in positive mode and
3100 V in negative mode
Sheath gas pressure (N
2
):
30 (arbitrary units)
Auxiliary gas pressure (N
2
):
5 (arbitrary units)
Capillary temperature:
250 °C
Heater temperature (HESI-II):
300 °C
Resolution:
50,000 (FWHM at
m/z
200)
Acquisition time:
20.00 min
Polarity switching:
One full cycle in less than 1 sec
The analysis was run using conditions described earlier
1,2
without doing any application-specific tuning of the
instrument. Quantitative and qualitative data were
collected in the same run and data file.
Results and Discussion
Data processing was carried out with ExactFinder
software for qualitative and quantitative workflows. All
analytes gave very good linear response in the calibration
range (0.02 to 0.60 µg/L) and did not show any
interference with other analytes or matrix components
(Figure 2). The quantitation data showed good
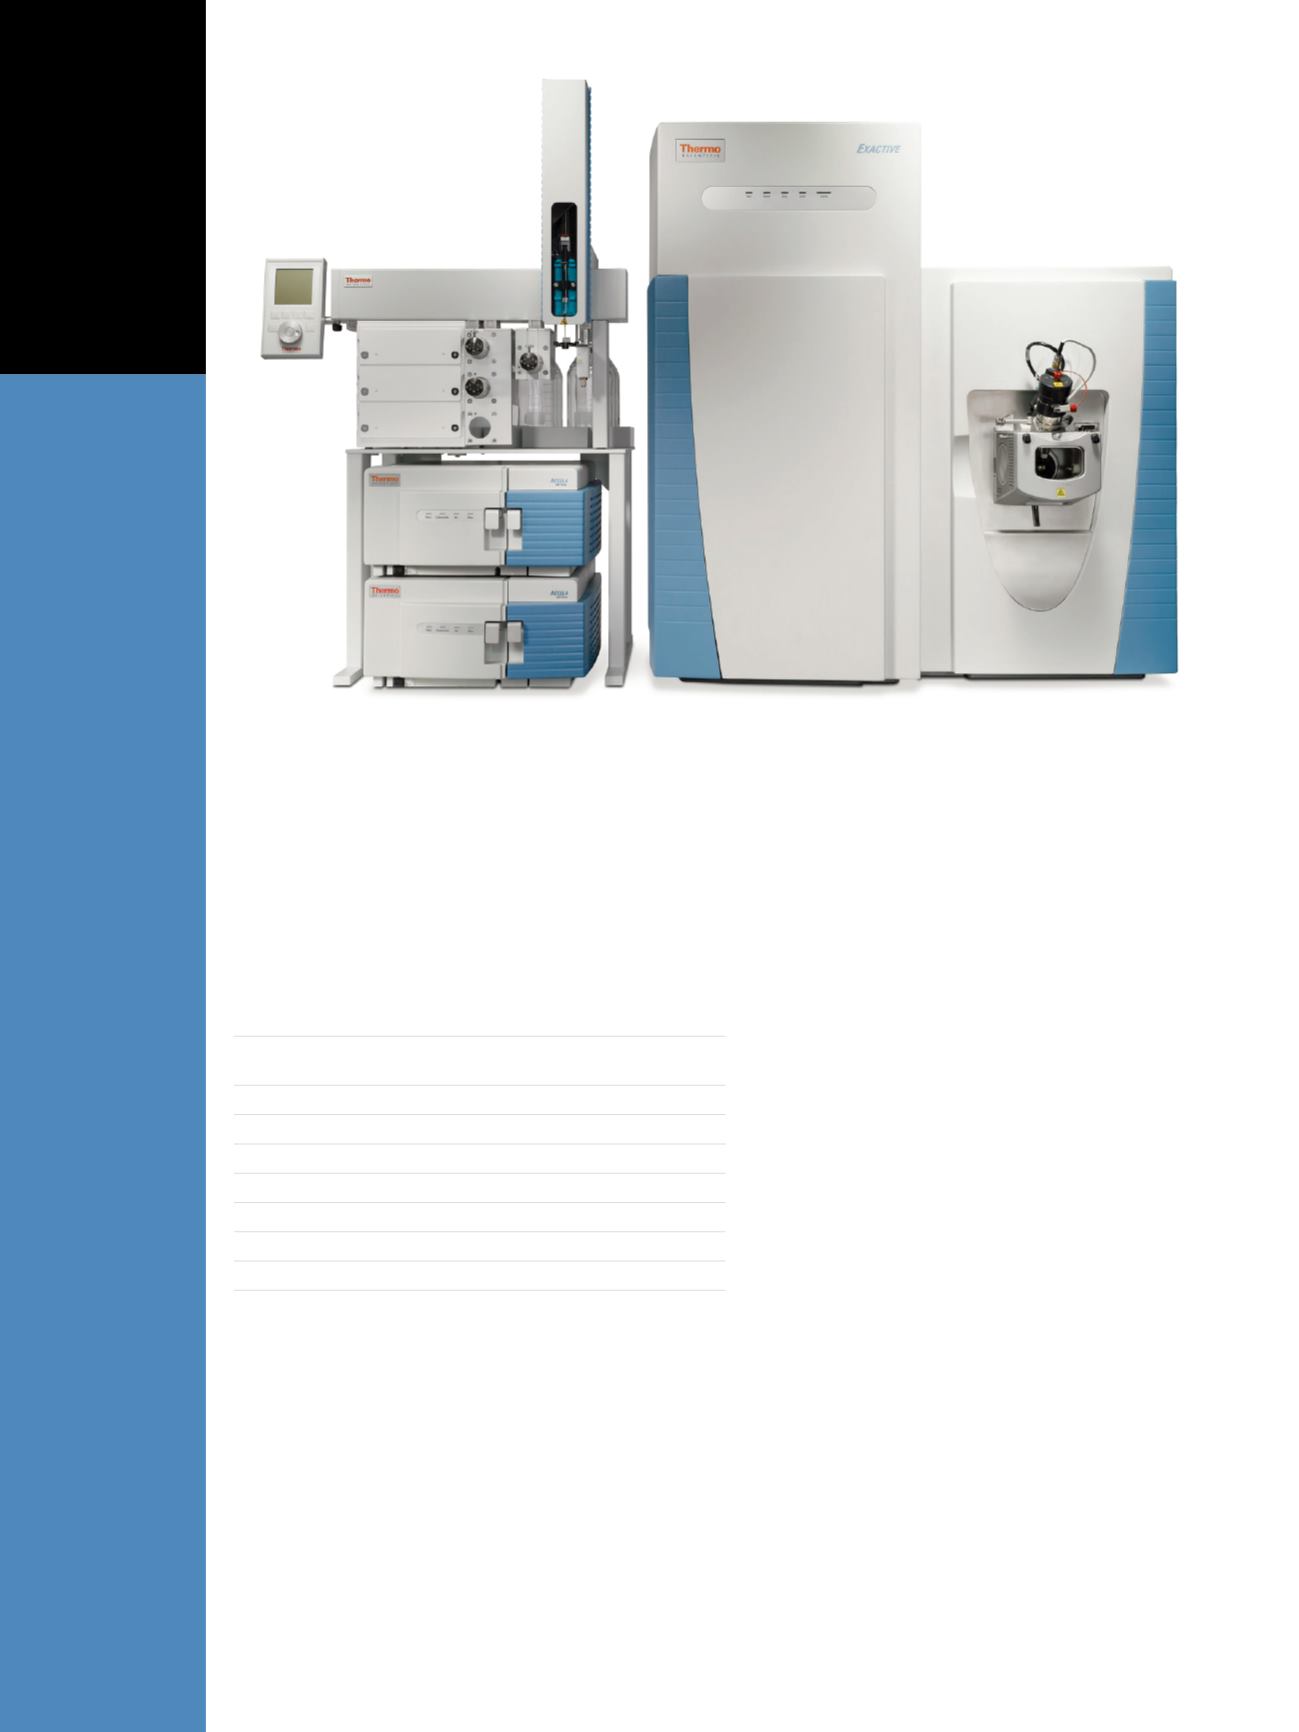
Figure 1. EQuan MAX system equipped with the Exactive mass spectrometer and ExactFinder software
reproducibility and good recovery rates, as determined
by the addition of internal standard to every sample. The
specificity of analysis was achieved by applying a mass
window of 5 ppm to the theoretical mass of the analytes.
In addition, both targeted and non-targeted screening
processes were applied to all samples. Exact mass and
retention time were used as identification criteria in the
targeted screen (Figure 3). Confirmation of identity was
achieved by automated matching of the given elemental
composition with the isotopic pattern of the determined
signal. An example of isotopic pattern matching is given in
Figure 4. ExactFinder software can also provide compound
identification through the following criteria: occurrence
of up to five fragment ions, library spectra match, and
internet database search via ChemSpider
®
.
The remaining peaks were also screened against
a larger compound list. For all signals, elemental
compositions were calculated based on the isotopic
distribution of a pre-defined list of elements.
The non-targeted screening yielded additional
compounds present in the samples. For example, in
addition to the targeted compounds, we found the
presence of carbendazim in some of the samples and
thiometoxam in one. For most of the signals, elemental
compositions were determined. All 20 analytes of interest
were easily quantified and assigned as knowns in the
automated screen. The non-targeted screening yielded
additional identifications of analytes without additional
analytical effort.