


 265 / 302

Sample Name
Area
ISTD Area
Area Ratio
Amount
RT
70ppt_Rep_2
28,335
14,060,852
0.002
0.069
8.236
70ppt_Rep_3
34,444
14,363,502
0.002
0.081
8.243
70ppt_Rep_4
31,241
13,625,849
0.002
0.078
8.234
70ppt_Rep_5
27,271
14,377,709
0.002
0.066
8.235
70ppt_Rep_6
31,189
14,662,503
0.002
0.073
8.234
70ppt_Rep_7
32,470
15,052,986
0.002
0.074
8.244
70ppt_Rep_8
38,823
15,153,194
0.003
0.086
8.240
Avg
31,967
14,470,942
0.002
0.075
8.238
StDev
3,868
539,063
0.000
0.007
0.004
%RSD
12.10
3.73
10.33
9.13
0.05
5
Sample Name
Area
ISTD Area
Area Ratio
Amount
RT
2ppm_Rep_2
823,612
15,064,599
0.055
1.655
8.238
2ppm_Rep_3
843,990
15,169,091
0.056
1.684
8.235
2ppm_Rep_4
857,227
15,163,169
0.057
1.711
8.231
2ppm_Rep_5
866,259
15,280,099
0.057
1.715
8.227
2ppm_Rep_6
822,302
14,467,495
0.057
1.720
8.239
2ppm_Rep_7
858,037
14,998,817
0.057
1.731
8.246
2ppm_Rep_8
839,242
14,638,036
0.057
1.735
8.236
Avg
844,381
14,968,758
0.056
1.707
8.236
StDev
17,202
301,550
0.001
0.029
0.006
%RSD
2.04
2.01
1.68
1.67
0.07
Figure 11. Precision in SIM/Full Scan mode at 0.07 and 2.0 ppb
Comparison
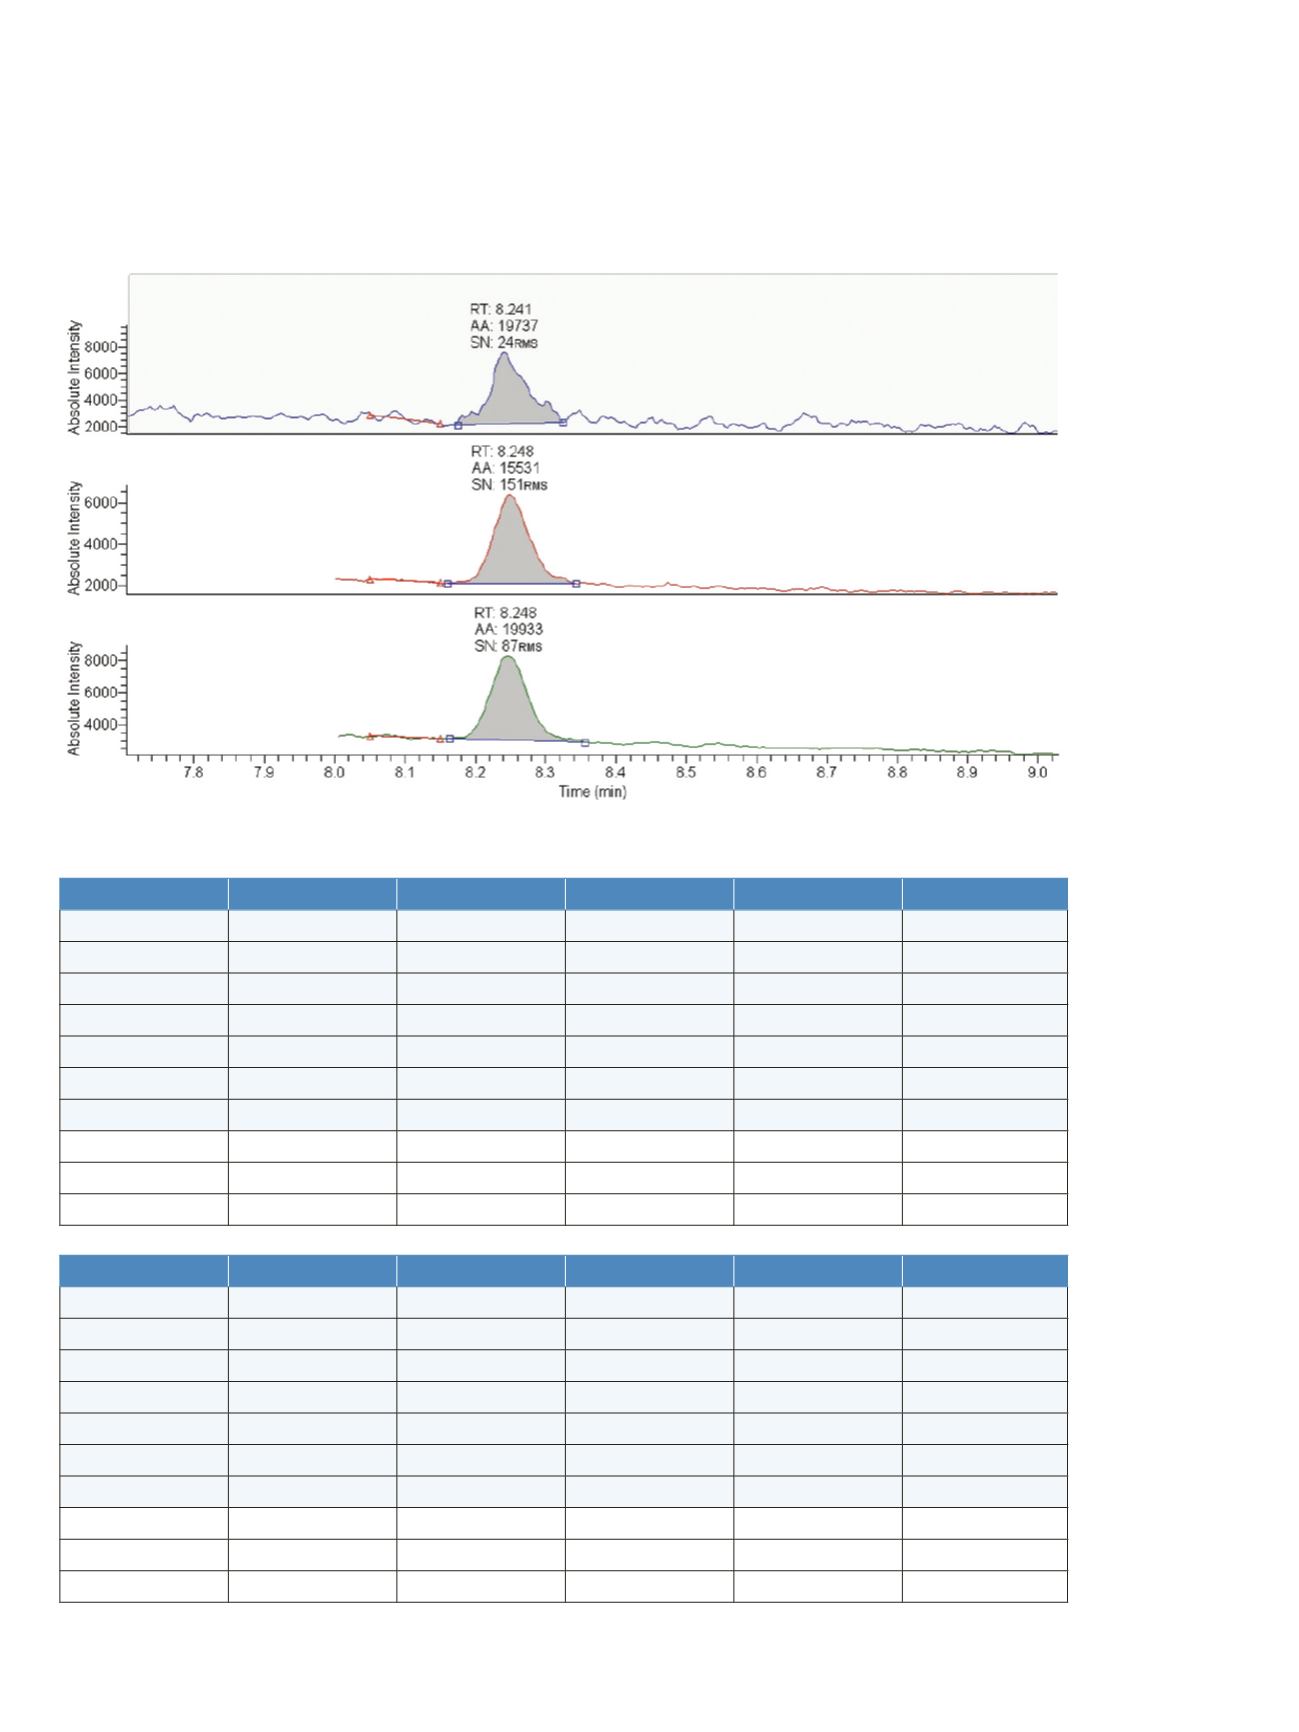
Figure 10 is a comparison of the peak shape of 0.05 ppb
in Full Scan, SIM and sequential SIM/Full Scan modes.
No loss of precision or accuracy results from using SIM/
Full Scan vs. SIM alone. However, by using the SIM/Full
Scan mode additional compounds can be identified using
a NIST or other library.
Figure 10. 0.05 ppb of 1,4-dioxane in Full Scan (S/N = 24), SIM (S/N = 151), and SIM/Full Scan (S/N = 87) modes
Reproducibility of the SIM/Full Scan mode was tested
by injecting seven replicates from the same vial at
concentrations of 0.07 and 2.0 ppb. The results are
reported in Figure 11.
FULL SCAN
SIM
SIM/FULL SCAN