


 264 / 302

4
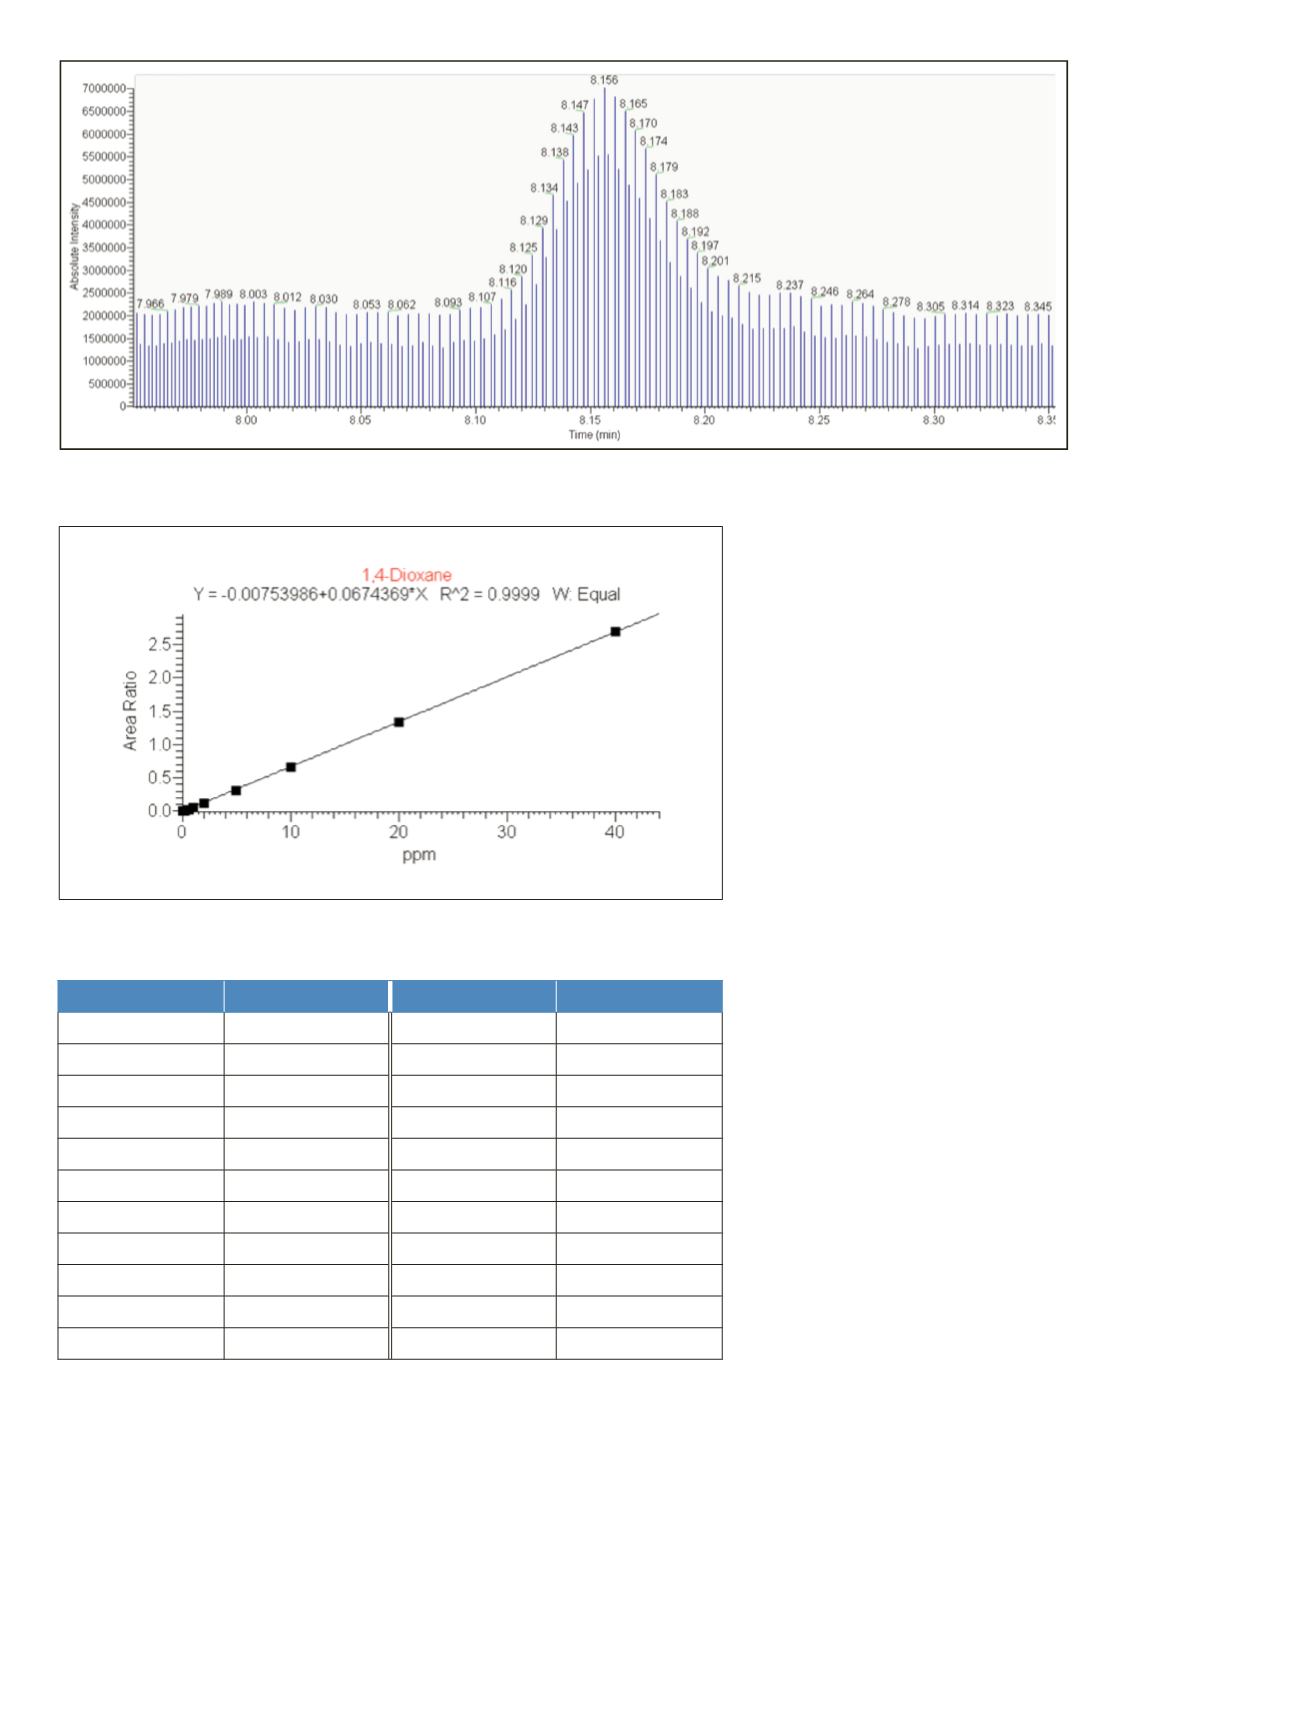
Figure 7. Chromatogram demonstrating the alternating SIM/Full Scan mode of data collection
Figure 8. Sequential SIM/Full Scan calibration curve 0.05 to 40 ppb of dioxane
Specified Amount Calculated Amount Specified Amount Calculated Amount
0.050
0.157
0.050
0.061
0.070
0.176
0.070
0.081
0.100
0.199
0.100
0.103
0.200
0.287
0.200
0.193
0.500
0.514
0.500
0.423
1.000
0.980
1.000
0.896
2.000
1.940
2.000
1.869
5.000
4.757
5.000
4.724
10.000
9.840
10.000
9.877
20.000
19.997
20.000
20.172
40.000
40.074
40.000
40.523
Figure 9. Equal weighting (left) vs. 1/x weighting (right) results for calibration curves. 1/x
weighting provides better accuracy at lower concentrations