


 263 / 302

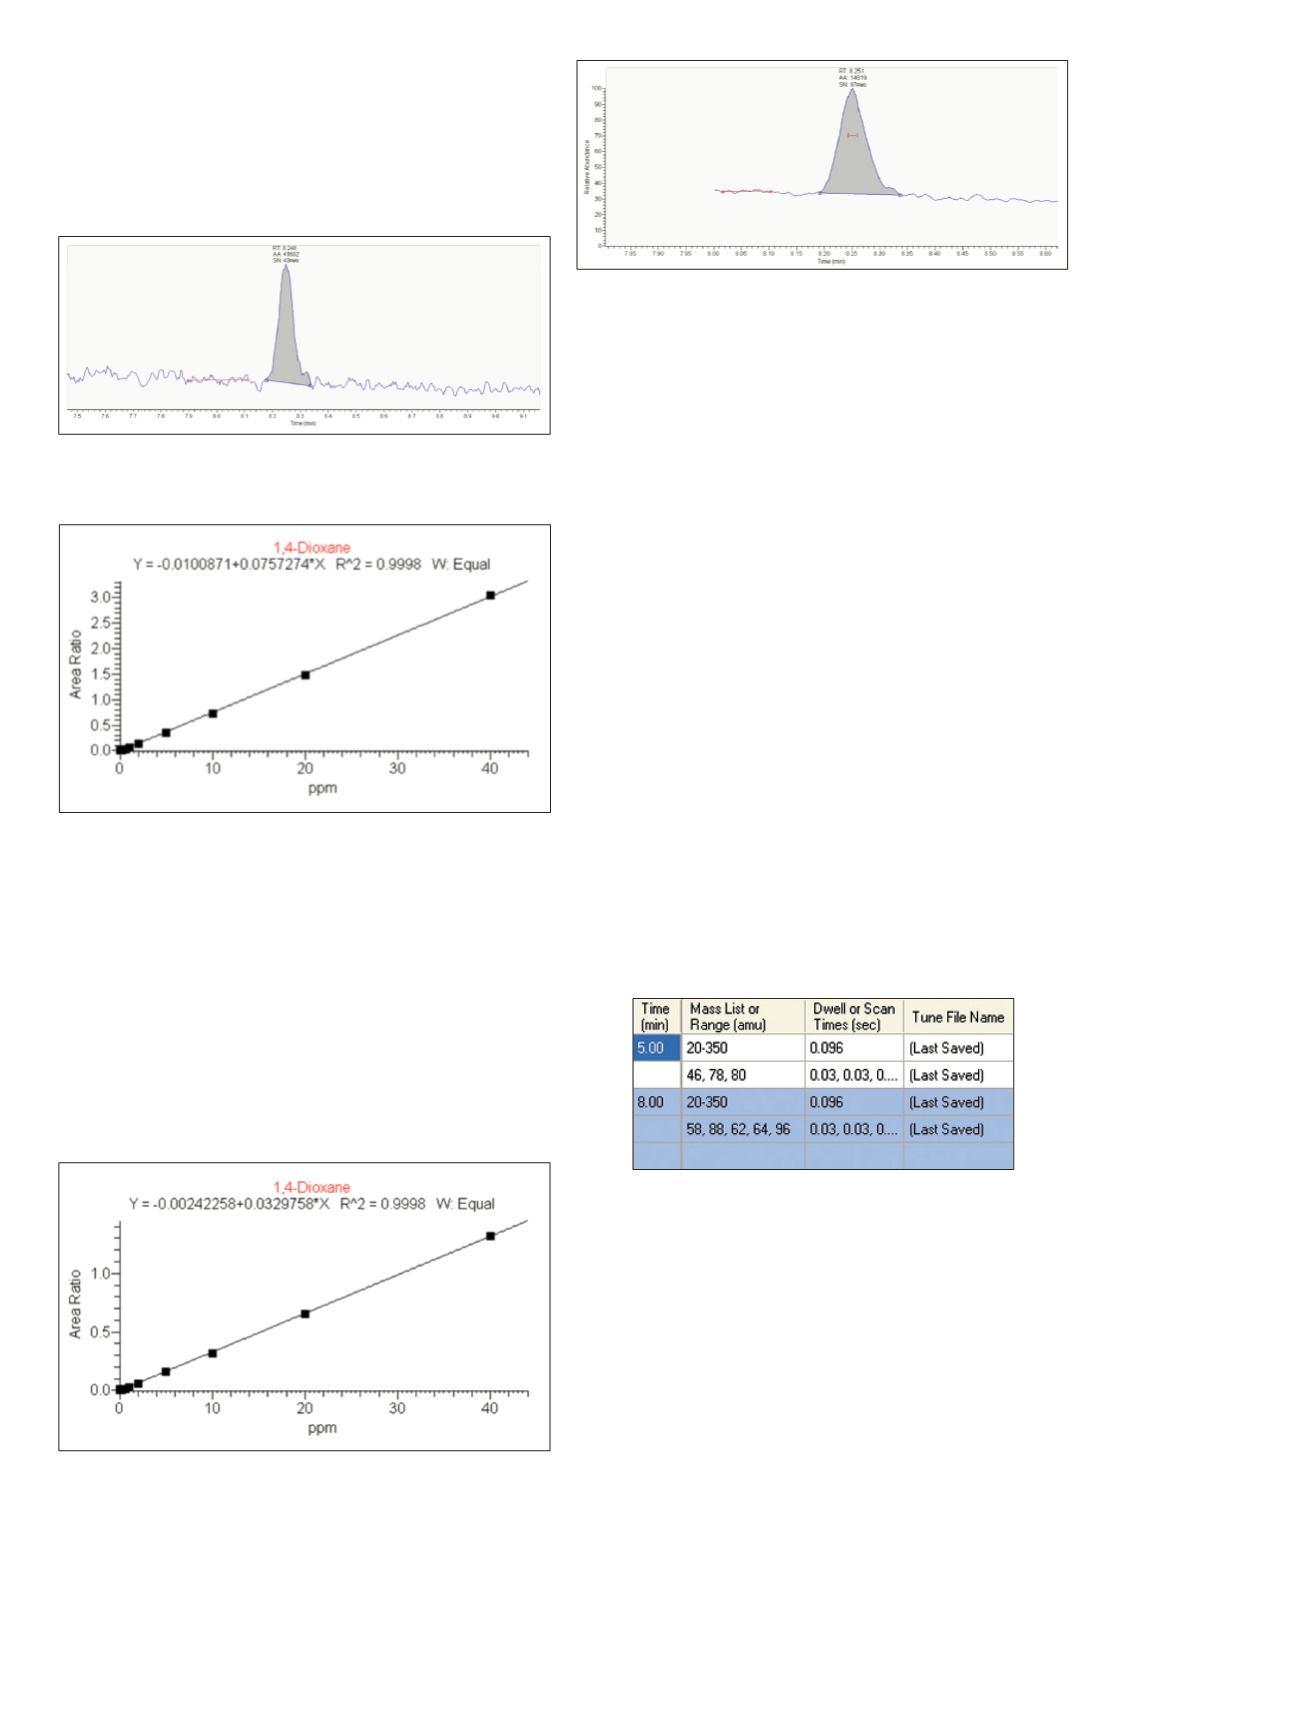
Full Scan Results
A calibration curve was created in Full Scan mode from
0.05 to 40 ppb of 1,4-dioxane. Figure 2 demonstrates
the peak shape and S/N ratio at 0.1 ppb. The Full Scan
calibration curve with an R
2
value of 0.9998 is presented
in Figure 3.
Figure 2. 1,4 -Dioxane at a concentration of 0.1 ppb with S/N = 43
in Full Scan
3
Figure 3. Full Scan calibration curve 0.05 to 40 ppb of 1,4-dioxane
SIM Results
A calibration curve was created in SIM mode from 0.05
to 40 ppb of 1,4-dioxane by monitoring three ions for the
internal standard (46, 78, and 80), three ions for the
surrogate (62, 64, 96), and two for the target compound
(58, 88). Figure 4 shows the resulting calibration curve
with an R
2
value of 0.9998. The chromatogram of the
0.05 ppb standard is depicted in Figure 5. At half the
concentration of the full scan the S/N ratio is twice as
high, highlighting the power of selected ion monitoring.
Figure 4. SIM mode calibration curve 0.05 to 40 ppb of
1,4-dioxane
Figure 5. SIM analysis of 1,4-dioxane at 0.05 ppb with S/N = 97.
Note the two-fold improvement in the S/N ratio in the SIM mode at
one-half the concentration of 1,4-dioxane shown in the full scan
in Figure 2.
Sequential SIM/Full Scan
The advantage of the SIM/Full Scan mode (tandem Full
Scan/SIM) is the ability to identify additional peaks in
unknown samples using a NIST or other library. Figure 6
provides the setup parameters for the SIM/Full Scan
method in the software. Each scan segment contains both
the SIM ions and scanning from 45 to 450 amu (Full
Scan). SIM and the Full Scan alternate during the data
collection. This is visualized in Figure 7, where the shorter
scans are the SIM scans and the taller scans are the Full
Scans. 1,4-Dioxane standards were analyzed from 0.05 to
40 ppb (Figure 8). According to EPA Method 522, each
point on the curve must be within ± 20% of the true
value, except the lowest point on the curve, which must be
within ± 40%.
3
Even though the calibration curve is linear
(R
2
= 0.9999), the curve only meets this criteria down to
0.5 ppb. By weighting the curve 1/x, the curve meets the
criteria down to 0.05 ppb (Figure 9). Weighting the curve
1/x places more importance on the lower concentrations
and has less influence in skewing the results, providing
better accuracy at lower levels.
Figure 6. MS Method Parameters page from software showing
SIM/Full Scan. Note that each segment can have its own specific
tune file.