


 258 / 302

6
Detection and Quantitation of Brominated and Chlorinated Hydrocarbons by DART with Linear Ion Trap and Triple Quadrupole Technology
Excel is a trademark of Microsoft Corporation. DART-SVP is a trademark of IonSense. All other trademarks are
the property of Thermo Fisher Scientific and its subsidiaries.
This information is not intended to encourage use of these products in any manners that might infringe the
intellectual property rights of others.
Sample
Area Calc Amount
100ppbQC
16028
128
Spiked Water
49620
258
Sample
Area Calc Amount
100ppbQC
1326
92.7
Spiked Water
11558
331.0
Sample
Area Calc Amount
100ppbQC
878
117
Spiked Water
2489
332
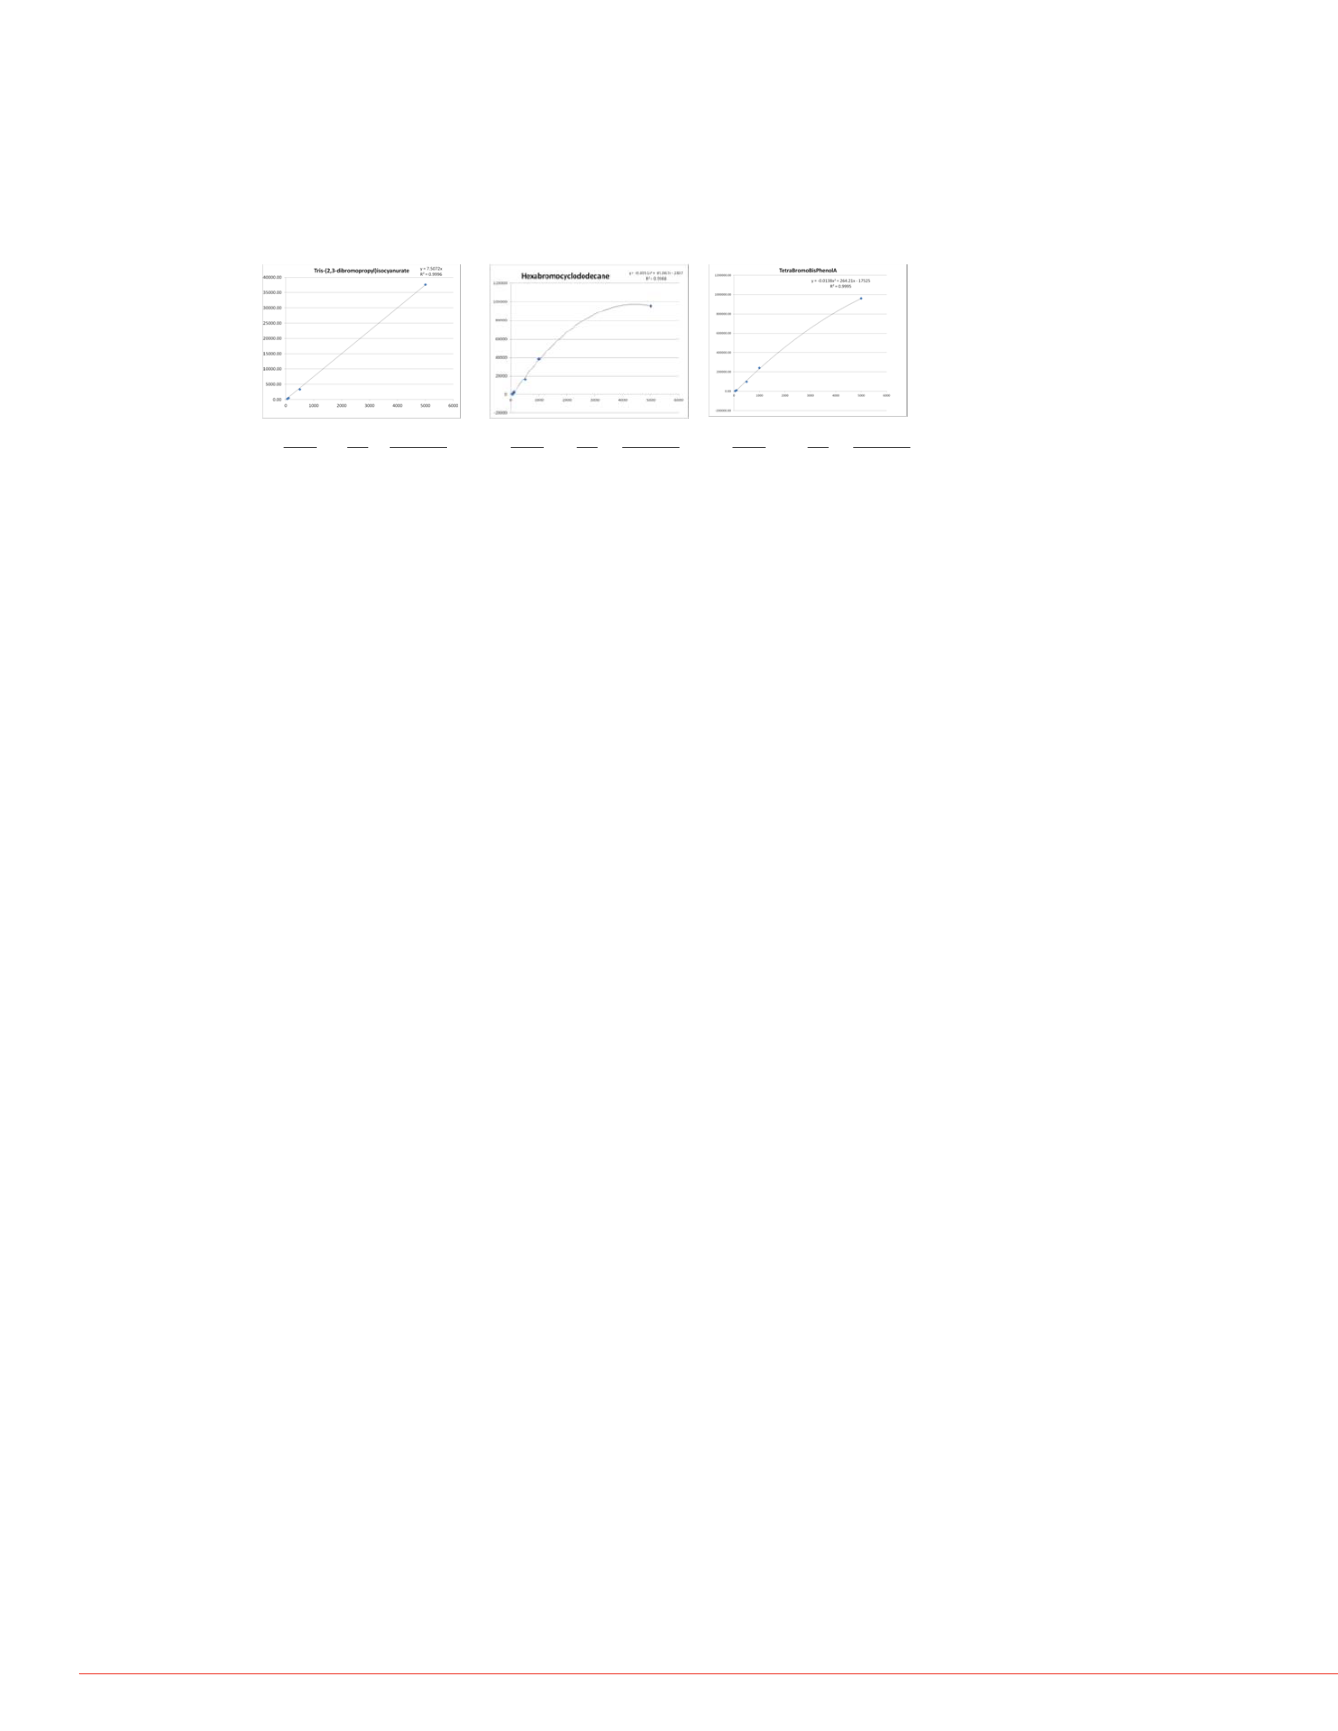
FIGURE 4. Calibration curves and results for; tris(2,3-dibromopropyl)isocyanurate,
1,2,5,6,9,10-hexabromocyclododecane, tetrabromobisphenol A
A San Francisco (SF) water sample was analyzed by spotting 10µL, as previously
described, and drying at 60 ºC for ten minutes. No BFRs or OCs were detected
(Figure 3). It is interesting to note that when the 500 ppb standard was spiked into the
SF water sample the compound response varied greatly, most noticeably with an
enhancement of tetrabromophthalic anhydride and a lower-than-expected response for
tetrabromobisphenol A, 1,2,5,6,9,10-hexabromocyclododecane, and tris(2,3-
dibromopropyl)isocyanurate (Figure 3). This variation indicates the importance of
applying the standards in the same matrix as the sample that is being analyzed. Thus,
while sample variation was observed, the method shows promise as a quick, simple
method of detecting and quantitating BFRs and OCs, with additional work to address
the effect of labeled standards and matrixes.
Conclusions
The linear ion trap MS with the DART-SVP in 1D transmission mode provided an
excellent method of detecting BFRs and OCs, providing precursor and fragment
ion information.
The Quantum Access MAX MS with the DART-SVP in direct infusion mode
generated full scan spectra for BFRs and OCs that 1) generated a high quality
match to theoretical spectra confirming the precursor information provided by the
linear ion trap and 2) facilitated the automated optimization of tube lens voltages,
transition fragments, and collision energies.
BFR and OC quantitative experiments were performed and LODs were found to
be as low as 50 ppb for several compounds.
Further work to minimize sample response variation and investigate the effect of
matrix on sample response will be performed.
DART-SVP provides a quick simple method of analyzing BFRs and OCs without
the need for sample preparation or chromatographic method development.
References
1. Emerging Brominated Flame Retardants in the Environment, Cynthia A. de Wit,
Amelie Kierkegaard, Niklas Ricklund, and Ulla Sellstro¨m, E. Eljarrat and D.
Barcelo´ (eds.), Brominated Flame Retardants, Springer-Verlag Berlin
Heidelberg 2010, Published online: 9 December 2010
Acknowledgements
We would like to thank IonSense Corporation for providing the DART-SVP source.
nel depicts the
zene
henol A
abromocyclododecane
propyl)isocyanurate
08:56PM
1 ppm
2.2 2.4 2.6 2.8 3.0 3.2 3.4 3.6 3.8 4.0
in)
RT: 3.08
RT: 2.78
RT: 2.49
RT: 2.19
RT: 3.38
RT: 3.55
RT: 4.05
RT: 3.18
RT: 2.56
RT: 2.25
RT: 2.86
RT: 3.47
RT: 4.07
RT: 3.62
RT: 2.18
RT: 2.80
RT: 4.00
RT: 3.68
RT: 3.35
RT: 2.98
RT: 3.09 RT: 3.39
RT: 2.20 RT: 2.49 RT: 2.81
RT: 3.81
RT: 3.58
RT: 3.11
RT: 2.81
RT: 2.20
RT: 2.51
RT: 3.42
NL: 6.54E3
TICF: - c NSISRMms2 506.690
[424.802-424.804, 426.759-426.761] MS ICIS
1ppm_AC
NL: 5.51E3
TICF: - c NSISRMms2 306.855
[265.826-265.828] MS ICIS 1ppm_AC
NL: 2.42E1
TICF: - c NSISRMms2 370.757
[79.200-79.202, 81.098-81.100,
326.725-326.727] MS ICIS 1ppm_AC
NL: 4.56E3
TICF: - c NSISRMms2 398.711
[326.725-326.727, 354.834-354.836] MS ICIS
1ppm_AC
NL: 8.04E2
TICF: - c NSISRMms2 436.716
[81.055-81.057, 247.648-247.650,
356.593-356.595] MS Genesis 1ppm_AC
2.2 2.4 2.6 2.8 3.0 3.2 3.4 3.6 3.8 4.0 4.2
e (min)
RT: 3.42
RT: 2.79
T: 2.19
RT: 3.11
RT: 2.51
RT: 3.10
RT: 2.78
T: 2.19 RT: 2.49
RT: 3.40
RT: 3.10
RT: 2.78
RT: 2.48
T: 2.17
RT: 3.41
RT: 3.10
RT: 2.48 RT: 2.78
RT: 3.41
T: 2.19
NL: 1.78E2
TIC F: - cNSISRMms2486.588
[377.999-378.001, 379.727-379.729] MS
Genesis 1ppm_AC
NL: 5.96E4
TIC F: - cNSISRMms2542.707
[290.795-290.797, 417.949-417.951,
419.722-419.724] MS Genesis
1ppm_AC
NL: 9.59E3
TIC F: - cNSISRMms2640.651
[79.095-79.097, 81.055-81.057] MS
Genesis 1ppm_AC
NL: 4.99E3
TIC F: - cNSISRMms2727.605
[79.298-79.300, 81.030-81.032] MS
Genesis 1ppm_AC
1 ppm
9:16:41PM
SFWaterspikedw/500ppb
2.5
3.0
3.5
4.0
min)
RT: 3.19
RT: 2.57
RT: 2.25
RT: 3.67
RT: 2.85
RT: 3.18
RT: 2.24
RT: 2.86
RT: 4.08
RT: 3.68
RT: 3.39
RT: 3.49
RT: 3.13
RT: 3.68
RT: 2.81
RT: 2.56
RT: 2.18
RT: 3.51
RT: 2.58
RT: 3.21
RT: 2.85
RT: 2.24
RT: 3.97
RT: 3.47
RT: 2.89
RT: 2.54
RT: 2.34
NL: 3.42E1
TICF: -cNSISRMms2 506.690 [424.802-424.804,
426.759-426.761] MS ICIS SF_Water_SpikedI_AC
NL: 7.46E1
TICF: -cNSISRMms2 306.855 [265.826-265.828]
MS ICISSF_Water_SpikedI_AC
NL: 2.23E1
TICF: -cNSISRMms2 370.757 [79.200-79.202,
81.098-81.100, 326.725-326.727] MS ICIS
SF_Water_SpikedI_AC
NL: 8.66E3
TICF: -cNSISRMms2 398.711 [326.725-326.727,
354.834-354.836] MS ICIS SF_Water_SpikedI_AC
NL: 8.35E1
TICF: -cNSISRMms2 436.716 [81.055-81.057,
247.648-247.650, 356.593-356.595] MS Genesis
SF_Water_SpikedI_AC
2.5
3.0
3.5
4.0
e (min)
T: 2.26 RT: 2.64
RT: 3.48
RT: 3.18
RT: 2.57
T: 2.27
RT: 2.85
RT: 2.53
T: 2.23
RT: 3.44
RT: 2.84 RT: 3.14
RT: 2.54
RT: 3.12 RT: 3.47
T: 2.23
RT: 2.84
NL: 1.50E1
TICF: - cNSISRMms2 486.588
[377.999-378.001, 379.727-379.729] MS
Genesis SF_Water_SpikedI_AC
NL: 1.89E4
TICF: - cNSISRMms2 542.707
[290.795-290.797, 417.949-417.951,
419.722-419.724] MS Genesis
SF_Water_SpikedI_AC
NL: 3.81E3
TICF: - cNSISRMms2 640.651
[79.095-79.097, 81.055-81.057] MS Genesis
SF_Water_SpikedI_AC
NL: 7.31E2
TICF: - cNSISRMms2 727.605
[79.298-79.300, 81.030-81.032] MS Genesis
SF_Water_SpikedI_AC
spiked w/ 500 ppb
All compound peaks corresponding to each kepone peak were averaged to generate a
data point at each level. A minimum of nine peaks were required for the level to be
included in a curve. Chromatograms and results for some of the compounds are shown
in Figure 4.