


 256 / 302

4
Detection and Quantitation of Brominated and Chlorinated Hydrocarbons by DART with Linear Ion Trap and Triple Quadrupole Technology
positioned above
. Always leave at
d the figure.
cal rule to the right.
utting figures side
Each column is
ch detail that it
s going to have the
cal
(most
tope)
Observed precursor
for MS/MS and
proposed ionization
mechanism
Fragments
(monitored
SRM
transitions)
9.8)
306.9
[M+OH-HBr]
-
C
9
H
7
Br
2
O
2
265.8
7.8)
459.6
[M+O
2
]
-
C
8
H
12
Br
4
O
2
Weak
fragmentation
9.63)
436.7
[M+OH-HBr]
-
C
8
H
5
Br
4
O
81.0, 274.7,
356.6
9.6)
370.8
[M+O+OH-2HBr]
-
C
8
H
4
Br
3
O
2
79.0, 81.0,
326.7
51.5)
486.5
[M+OH-HBr]
-
C
6
Br
5
O
378.0, 380.0
3.8)
542.8
[M-H]
-
C
15
H
11
Br
4
O
2
290.8, 417.8,
419.8
8.6)
727.5
[M-H]
-
C
12
H
14
B
r6
N
3
O
3
79.0, 81.0
3.7)
398.7
[M+OH-HBr]
-
C
8
Br
3
O
4
326.8, 354.8
1.6)
640.62
[M-H]
-
C
12
H
17
Br
6
79.0, 81.0
9.7)
506.8
[M+OH]
-
C
10
Cl
10
O
2
H
424.8, 426.8
posed ionization
itions. All precursor
triple stage
h an asterisk were
le via peek tubing to a
al clamp. The needle
the ceramic capillary
at rates ranging from
es showed that the
optimum ionization
ined to be 400 ºC. The
r ion trap MS data. It
re not initially
temperature being too
trate a pattern in the
drogen bonded to a
lose a proton to form
gen atoms or
ose HBr.
ion method was used
curves for the
ring the CE
hose observed in the
fragmentation in the
allyl 2,4,6-tribromophenyl ether
300
305
310
315
m/z
0
20
40
60
80
100
0
20
40
60
80
100
RelativeAbundance
306.61
304.93 308.71
301.01
310.11 312.84 317.04
306.88
304.89
308.88
309.95 313.00
NL:
1.50E5
2-4-6--tribromophenyl-allyl-
ether#30-54 RT: 0.26-0.46
AV: 25T: -pNSIQ1MS
[217.070-517.000]
NL:
1.06E4
C
9
H
7
Br
2
O
2
:
C
9
H
7
Br
2
O
2
p(gss, s/p:40)Chrg-1
R:
500Res.Pwr.@FWHM1,2,5,6-tetrabromo cyclooctane
454
456
458
460
462
464
466
m/z
0
20
40
60
80
100
0
20
40
60
80
100
RelativeAbundance
459.67
461.64
461.99
457.56
463.61
455.59
459.75
457.76
461.75
455.76
463.75
464.80
NL:
4.67E3
tetraBromoCycloOctane_SI
M#613-811 RT: 3.15-4.17
AV: 199T: -pNSIQ1MS
[454.670-464.600]
NL:
8.06E3
C
8
H
12
Br
4
O
2
:
C
8
H
12
Br
4
O
2
p(gss, s/p:40)Chrg-1
R:
800Res.Pwr.@FWHM2,3,4,5,6,-pentaBromoEthylBenzene
430
435
440
445
m/z
0
20
40
60
80
100
0
20
40
60
80
100
RelativeAbundance
436.60
434.64
438.42
432.68
440.73
441.64
431.00
444.93
436.70
434.70
438.70
432.72
440.70
441.78 443.86
NL:
2.01E6
PentaBromoEthylBenzene#
433-475 RT: 7.45-8.18
AV: 43T: -pNSIQ1MS
[249.700-749.630]
NL:
8.08E3
C
8
H
5
Br
4
O:
C
8
H
5
Br
4
O
1
p(gss, s/p:40)Chrg-1
R:
700Res.Pwr.@FWHM2-bromo-1,3-bis(dibromomethyl)benzen
e
366 368 370 372 374 376 378
m/z
0
20
40
60
80
100
0
20
40
60
80
100
RelativeAbundance
370.61 372.71
368.79
374.67
375.58
365.36
379.29
370.78 372.77
368.78
374.77
375.85 377.88
NL:
7.51E5
2-Br-1-3-bis-dibromomethyl-
benzene#225-292 RT:
3.84-4.99 AV: 68T: -pNSI
Q1MS [299.070-699.000]
NL:
8.16E3
C
8
H
4
Br
3
O
2
:
C
8
H
4
Br
3
O
2
p(gss, s/p:40)Chrg-1
R:
600Res.Pwr.@FWHMhexabromo benzene
480
485
490
495
m/z
0
20
40
60
80
100
0
20
40
60
80
100
RelativeAbundance
486.57 488.53
488.81
484.47
490.42
482.51
492.66
493.64
480.62
486.58 488.58
484.58
490.58
482.59
492.58
494.67
NL:
8.32E4
HexaBromoBenzene#101-
255 RT: 1.75-4.40 AV:
155T: - pNSIQ1MS
[301.070-801.000]
NL:
6.97E3
C
6
Br
5
O:
C
6
Br
5
O
1
p(gss, s/p:40)Chrg-1
R:
800Res.Pwr.@FWHMtetra-bromo bisphenol A
530
535
540
545
550
555
m/z
0
20
40
60
80
100
0
20
40
60
80
100
RelativeAbundance
542.65
540.69 544.54
538.66
546.64
547.69
558.82
556.65
537.96
528.93
542.75
540.73 544.75
546.76
547.84
NL:
2.31E5
TetraBromoBisPhenolA#80-
140 RT: 1.37-2.41 AV: 61
T: - pNSIQ1MS
[293.870-793.800]
NL:
7.53E3
C
15
H
11
Br
4
O
2
:
C
15
H
11
Br
4
O
2
p(gss, s/p:40)Chrg-1
R:
800Res.Pwr.@FWHMFIGURE 1. TSQ full scan infusion data. Acquired spectra versus theoretical
spectra for observed precursors demonstrating proposed ionization
mechanisms. Top spectrum in each pair is the acquired data; lower spectrum is
theoretically generated spectrum based on proposed formulas.
Panel B of Figure 2 depicts a spectrum automatically generated on the TSQ MS from
the auto-tune procedure in which the CE is automatically stepped from low to high and
the most intense fragments are automatically selected as transition ions (Table 1).
Quantitative experiments
After the infusion experiments, the 10-spot linear rail for 1D transmission experiments
was installed. Kepone was selected as a reference compound, due to its highly efficient
ionization, and spiked into all samples at a level of 100 ppb. Data was acquired in the
free run mode with a constant rail speed of 0.7 mm/sec. This mode was chosen to
generate the best approximation of Gaussian shaped peaks (Figure 3) and avoid
spiking that can occur when the rail moves discretely to each spot.
The results of calibrators and samples are shown in Figure 3, each peak represents the
signal from a single spot. Each chromatogram should contain a total of ten peaks from
one pass through the 10-spot rail. 5 µL of sample was applied to each spot in a
horizontal line through the center of the spot. This process was repeated twice for a
total application of 10 µL. Several of the compounds were detected as low as 50 ppb,
specifically tetrabromobisphenol A, 1,2,5,6,9,10-hexabromocyclododecane, and
tris(2,3-dibromopropyl)isocyanurate. Unfortunately, the reproducibility at this level was
poor. It was determined that each compound responded differently. Thus, it was not
possible to normalize responses with kepone, our reference compound. Poor
reproducibility was most likely a function of the spotting technique and could easily
have been compensated for by the use of labeled internal standards. However, even
given the variation in response from spot to spot it was possible to obtain some
quantitative information. Peak areas for each chromatogram were exported to Excel.
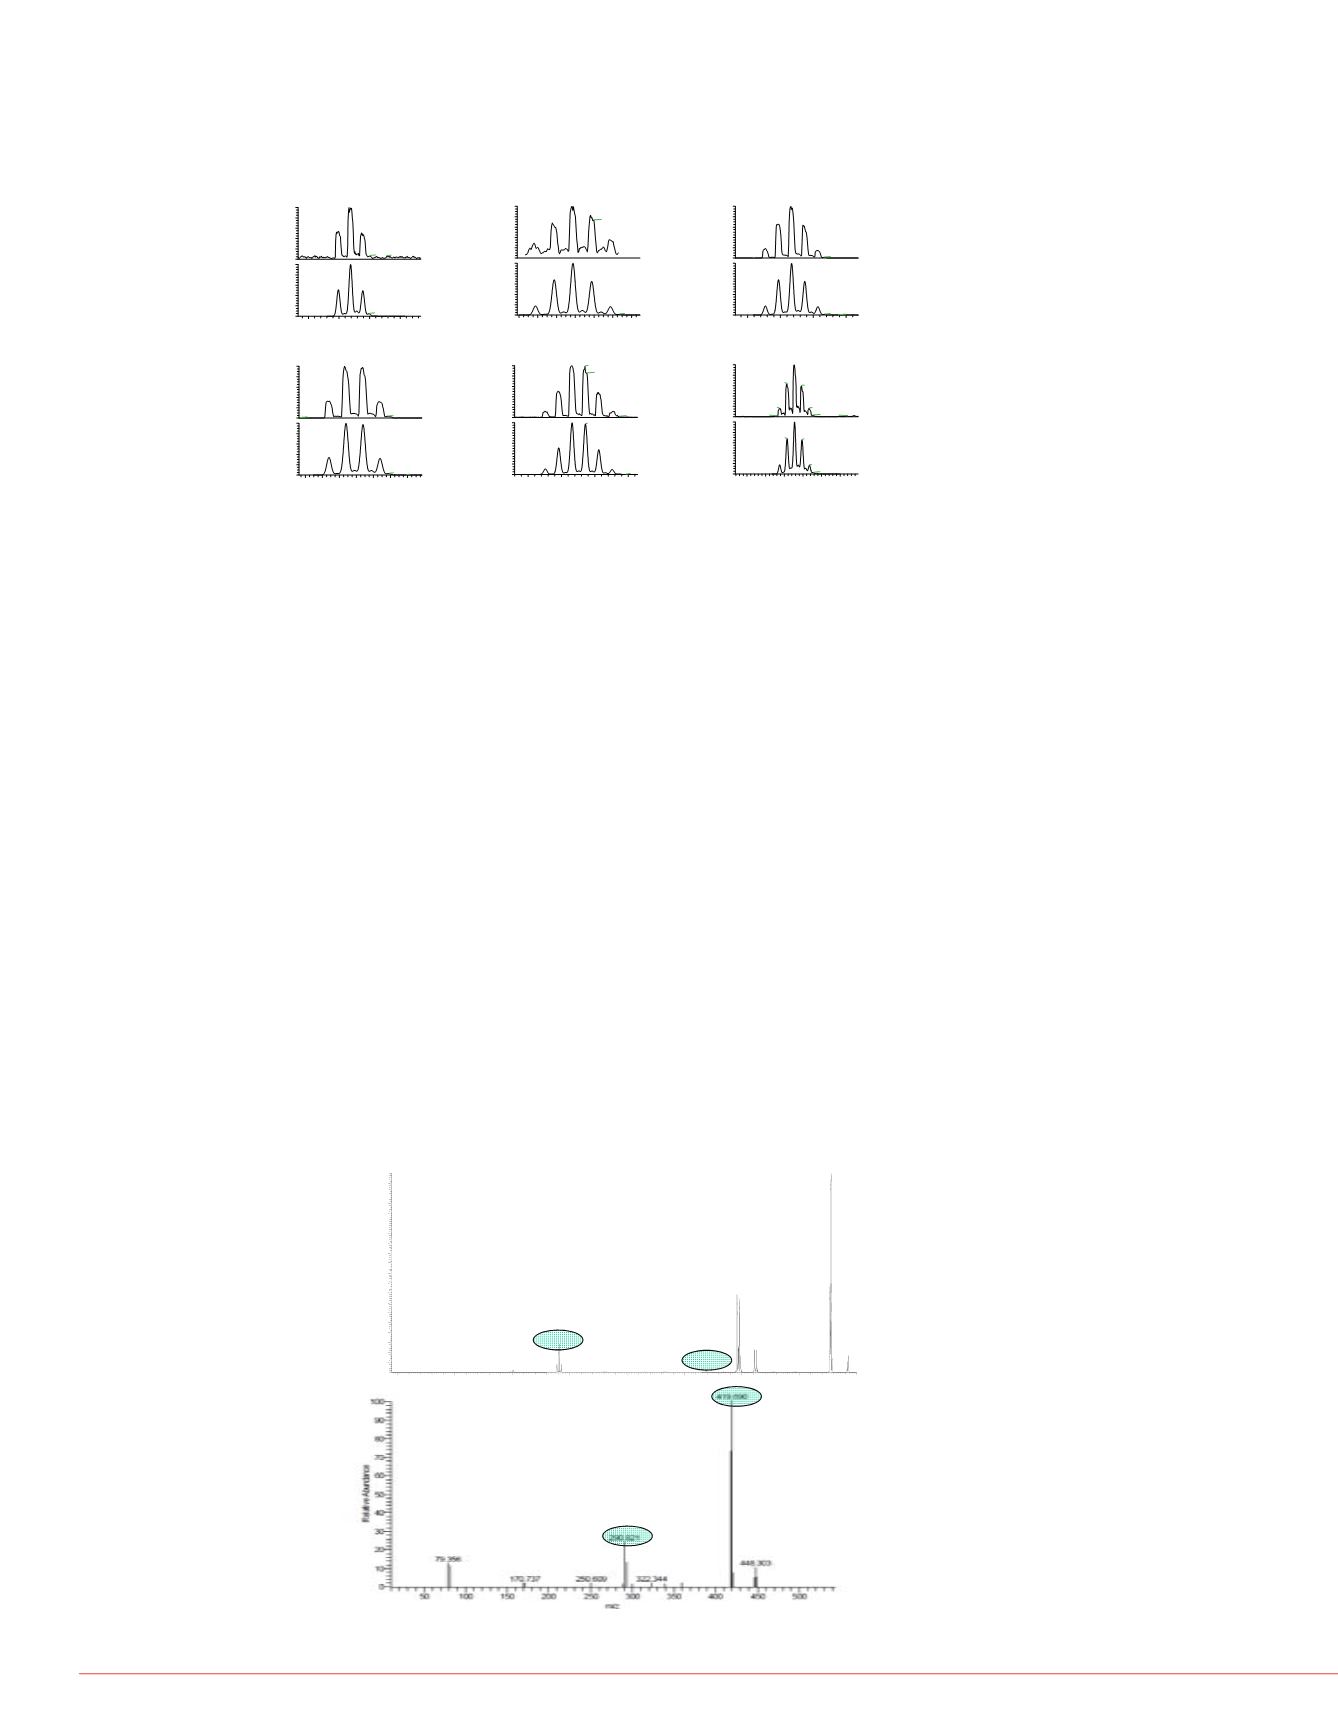
FIGURE 2. MS/MS Spectra for tetrabromobisphenol A. Panel A depicts linear ion
trap data, Panel B depicts triple quad data. Linear ion trap data was acquired with
a normalized collision energy of 35V, triple quadrupole data was generated with
stepped collision energy in the auto-tune process.
A
B
542_8
_BFRs_225C_008 # 13-14 RT: 0.11-0.11
AV:
2
NL:
5.27E3
T:
I MS
-pNSIFullms2542.80@cid35.00 [145.00-550.00]
150
200
250
300
350
400
450
500
550
m/z
0
5
10
15
20
25
30
35
40
45
50
55
60
65
70
75
80
85
90
95
100
RelativeAbundance
527.67
445.83
291.00
460.92
542.83
419.92
515.17
498.08
478.92
FIGURE 3. TSQ MS data for calibrato
compounds in the following order fr
1) kepone
2) allyl 2,4,6-tribromophenyl ether
3) 2-bromo-1,3-bis(dibromomethyl)
4) tetrabromophthalic anhydride
5) 2,3,4,5,6-pentabromoethylbenze
C:\Blackburn\...\50ppb_AC
5/3/20127:45:48PM
50ppb
5uL line2X,10uL total
RT:
0.00 -4.10
SM:
7G
0.0 0.2 0.4 0.6 0.8 1.0 1.2 1.4 1.6 1.8 2.0 2.2 2.4 2.6 2.8 3.0 3.2 3.4 3.6 3.8 4.0
Time (min)
0
50
100
0
50
100
0
50
100
Relative Abundance
0
50
100
0
50
100
RT: 2.91
RT: 3.22
RT: 2.31 RT: 2.61
RT: 0.49
RT: 2.00
RT: 1.09
RT: 0.79
RT: 1.40 RT: 1.70
RT: 3.94
RT: 3.73
RT: 0.24
RT: 2.54
RT: 2.09
RT: 3.17
RT: 1.71
RT: 0.61
RT: 3.76
RT: 1.27
RT: 0.99
RT: 0.21
RT: 0.87
RT: 1.46
RT: 2.01
RT: 1.77
RT: 3.85
RT: 3.40
RT: 2.69
RT: 2.45
RT: 0.25
RT: 1.39
RT: 3.23
RT: 2.92
RT: 2.24
RT: 1.03
RT: 3.72
RT: 2.43
RT: 2.05
RT: 0.23
RT: 3.23
RT: 2.93
RT: 1.94
NL: 1.24E4
TICF: -c NSISRMms2 506.690
[424.802-424.804, 426.759-426.76
50ppb_AC
NL: 2.56E1
TICF: -c NSISRMms2 306.855
[265.826-265.828] MS ICIS 50pp
NL: 2.12E1
TICF: -c NSISRMms2 370.757 [
81.098-81.100, 326.725-326.727]
50ppb_AC
NL: 1.96E1
TICF: -c NSISRMms2 398.711
[326.725-326.727, 354.834-354.83
50ppb_AC
NL: 1.85E1
TICF: -c NSISRMms2 436.716 [
247.648-247.650, 356.593-356.595
Genesis 50ppb_AC
RT:
0.00 -4.02
SM:
7G
0.0 0.2 0.4 0.6 0.8 1.0 1.2 1.4 1.6 1.8 2.0 2.2 2.4 2.6 2.8 3.0 3.2 3.4 3.6 3.8 4.0
Time (min)
0
50
100
0
50
100
0
50
100
Relative Abundance
0
50
100
RT: 2.91
RT: 1.40
RT: 0.77 RT: 1.09
RT: 2.00
RT: 3.22
RT: 0.47
RT: 2.33
RT: 1.74
RT: 2.65
RT: 2.59
RT: 2.94
RT: 0.79
RT: 2.29
RT: 1.10
RT: 3.24
RT: 1.70
RT: 1.38
RT: 2.01
RT: 0.49
RT: 2.92
RT: 2.60
RT: 3.18
RT: 1.06
RT: 2.01
RT: 1.38
RT: 1.67
RT: 0.81
RT: 2.31
NL: 7.17
TICF: - cNSISRMms2 48
[377.999-378.001, 379.727-
50ppb_AC
NL: 1.40E3
TICF: - cNSISRMms2 54
[290.795-290.797, 417.949-
419.722-419.724] MS Ge
50ppb_AC
NL: 1.71E2
TICF: - cNSISRMms2 64
[79.095-79.097, 81.055-81.
Genesis 50ppb_AC
NL: 1.02E2
TICF: - cNSISRMms2 72
[79.298-79.300, 81.030-81.
Genesis 50ppb_AC
50 ppb
C:\Blackburn\...\SF_Water_AC
5/3/20128:59:14PM
SFWater
5uL line2X,10uL total
RT:
0.00 -4.10
SM:
7G
0.0 0.2 0.4 0.6 0.8 1.0 1.2 1.4 1.6 1.8 2.0 2.2 2.4 2.6 2.8 3.0 3.2 3.4 3.6 3.8 4.0
Time (min)
0
50
100
0
50
100
0
50
100
Relative Abundance
0
50
100
0
50
100
RT: 2.82
RT: 3.96
RT: 3.26
RT: 2.18
RT: 1.95
RT: 1.48
RT: 0.72
RT: 0.45
RT: 0.28
RT: 1.94
RT: 1.22
RT: 3.88
RT: 3.61
RT: 3.42
RT: 3.19
RT: 2.55
RT: 2.26
RT: 2.04
RT: 1.75
RT: 1.58
RT: 0.86
RT: 0.56
RT: 0.12
RT: 3.35
RT: 2.72
RT: 2.13 RT: 2.44
RT: 3.88
RT: 1.40
NL: 9.83
TICF: - cNSISRMms2 506.690
[424.802-424.804, 426.759-426.761]
SF_Water_AC
NL: 9.02
TICF: - cNSISRMms2 306.855
[265.826-265.828] MS ICIS SF_Wat
NL: 1.94E1
TICF: - cNSISRMms2 370.757 [79.
81.098-81.100, 326.725-326.727] MS
SF_Water_AC
NL: 7.29E1
TICF: - cNSISRMms2 398.711
[326.725-326.727, 354.834-354.836]
SF_Water_AC
NL: 1.82E1
TICF: - cNSISRMms2 436.716 [81.
247.648-247.650, 356.593-356.595]
SF_Water_AC
RT:
0.00 -4.23
SM:
7G
0.0 0.2 0.4 0.6 0.8 1.0 1.2 1.4 1.6 1.8 2.0 2.2 2.4 2.6 2.8 3.0 3.2 3.4 3.6 3.8 4.0 4.2
Time (min)
0
50
100
0
50
100
0
50
100
Relative Abundance
0
50
100
RT: 0.97
RT: 3.19
RT: 2.14
RT: 1.84
NL: 7.05
TICF: - cNSISRMms2 4
[377.999-378.001, 379.727
MS SF_Water_AC
NL: 1.07E1
TICF: - cNSISRMms2 5
[290.795-290.797, 417.949
419.722-419.724] MS SF
NL: 1.16E1
TICF: - cNSISRMms2 6
[79.095-79.097, 81.055-81.
GenesisSF_Water_AC
NL: 7.02
TICF: - cNSISRMms2 7
[79.298-79.300, 81.030-81.
SF_Water_AC
SF Water
C:\Blackburn\...\100ppbQC
5/3/20127:03:19PM
100ppbsampleasQC
5uL line spotted2X, total10uL
RT:
0.00 -4.00
SM:
7G
0.0 0.2 0.4 0.6 0.8 1.0 1.2 1.4 1.6 1.8 2.0 2.2 2.4 2.6 2.8 3.0 3.2 3.4 3.6 3.8
Time (min)
0
50
100
0
50
100
0
50
100
Relative Abundance
0
50
100
0
50
100
RT: 3.62
RT: 3.33
RT: 1.51
RT: 2.14
RT: 1.82
RT: 3.01
RT: 2.73
RT: 2.42
RT: 1.21
RT: 0.91
RT: 0.53
RT: 1.86
RT: 1.29
RT: 2.51
RT: 1.60
RT: 2.20
RT: 2.79 RT: 3.10 RT: 3.40
RT: 1.01
RT: 3.91
RT: 3.74
RT: 0.54
RT: 2.98
RT: 2.76
RT: 1.56
RT: 3.48
RT: 2.32
RT: 2.02
RT: 1.07
RT: 0.76
RT: 0.35
RT: 3.27
RT: 3.59
RT: 2.72
RT: 0.88
RT: 1.51
RT: 2.45
RT: 1.77 RT: 2.09
RT: 3.95
RT: 0.54
RT: 1.02
RT: 1.51
RT: 1.93
RT: 2.82 RT: 3.12
RT: 2.53
NL: 7.06E3
TICF: -cNSISRMms2 506.690
[424.802-424.804, 426.759-426.761]
100ppbQC
NL: 1.35E2
TICF: -cNSISRMms2 306.855
[265.826-265.828] MS ICIS 100ppb
NL: 1.48E1
TICF: -cNSISRMms2 370.757 [7
81.098-81.100, 326.725-326.727] M
100ppbQC
NL: 3.80E2
TICF: -cNSISRMms2 398.711
[326.725-326.727, 354.834-354.836]
100ppbQC
NL: 8.81E1
TICF: -cNSISRMms2 436.716 [8
247.648-247.650, 356.593-356.595]
Genesis 100ppbQC
RT:
0.00 -4.01
SM:
7G
0.0 0.2 0.4 0.6 0.8 1.0 1.2 1.4 1.6 1.8 2.0 2.2 2.4 2.6 2.8 3.0 3.2 3.4 3.6 3.8 4.0
Time (min)
0
50
100
0
50
100
0
50
100
Relative Abundance
0
50
100
RT: 3.29
RT: 2.76
RT: 2.14
RT: 1.02
RT: 2.73
RT: 1.51
RT: 3.03
RT: 1.84
RT: 1.21
RT: 2.43
RT: 3.62
RT: 2.14
RT: 0.93
RT: 3.32
RT: 3.36
RT: 1.84
RT: 3.66
RT: 2.14
RT: 1.50
RT: 2.73 RT: 3.02
RT: 2.43
RT: 1.23
RT: 0.93
RT: 3.62
RT: 3.34
RT: 1.50
RT: 3.02
RT: 0.87
RT: 1.82
RT: 2.75
RT: 2.43
RT: 1.22
RT: 2.09
NL: 1.73E1
TICF: - cNSISRMms2 486.
[377.999-378.001, 379.727-3
Genesis 100ppbQC
NL: 5.97E3
TICF: - cNSISRMms2 542.
[290.795-290.797, 417.949-4
419.722-419.724] MS Gene
100ppbQC
NL: 4.32E2
TICF: - cNSISRMms2 640.
[79.095-79.097, 81.055-81.05
Genesis 100ppbQC
NL: 4.45E2
TICF: - cNSISRMms2 727.
[79.298-79.300, 81.030-81.03
Genesis 100ppbQC
100 ppb QC