


 251 / 302

Water treatment chemistry is a specialized field that
often uses proprietary technology. As such, it is difficult to
evaluate methods to reduce the environmental impact
from the operation of cooling water systems. The method
described here can detect the scale and corrosion
inhibitors at sub-part-per-billion levels, although most
cooling streams have part-per-million levels of scale and
corrosion inhibitors. Any adverse matrices are diluted
when the sample is diluted into the calibration range of
5-5000 ppb.
Compounds such as PSO and HPMA are proprietary
blends with many components. When issued, they are sold
in controlled, blended formulations. In the sample we
received, one main marker and its transitions were
examined. These marker ions, of
m/z
297 and
m/z
337,
respectively for PSO and HMPA, showed excellent
linearity over the quantitation range (Table 2).
Conclusion
The addition of scale and corrosion inhibitors to the water
stream in industrial cooling systems reduces corrosion and
allows repeat water cycling. While there is no current EPA
guideline for the amount of corrosion and scale inhibitors
released into the environment, interest in the
quantification of these products in released water has
increased. The minimum detection level established by this
method shows that low-level quantitation of scale and
corrosion inhibitors is possible, even in a high
concentration of laboratory-simulated matrix.
References
1. U.S. Environmental Protection Agency, Clean Water Act - Sec. 316(b) -
Thermal Discharges:
http://www.epa.gov/waterscience/316b/basic.htm(Accessed 07-19-09)
2. Wanjie International Co., Phosphonates Scale and Corrosion Inhibitors:
http://www.wuzhouchem.com/cataloged/WWP_SCI.htm(accessed 11-25-09)
3. Shangdong Taihe Water Treatment Co., Hydrolyzed Polymaleic Anhydride
(HPMA):
http://www.thwater.net/03-HPMA.htm(accessed 11-25-09)
4. Nalco Co., Phosphinosuccinic Oligomer (PSO):
http://extranet.nalco.com/PDF/o3267_final.pdf(accessed 11-25-09)
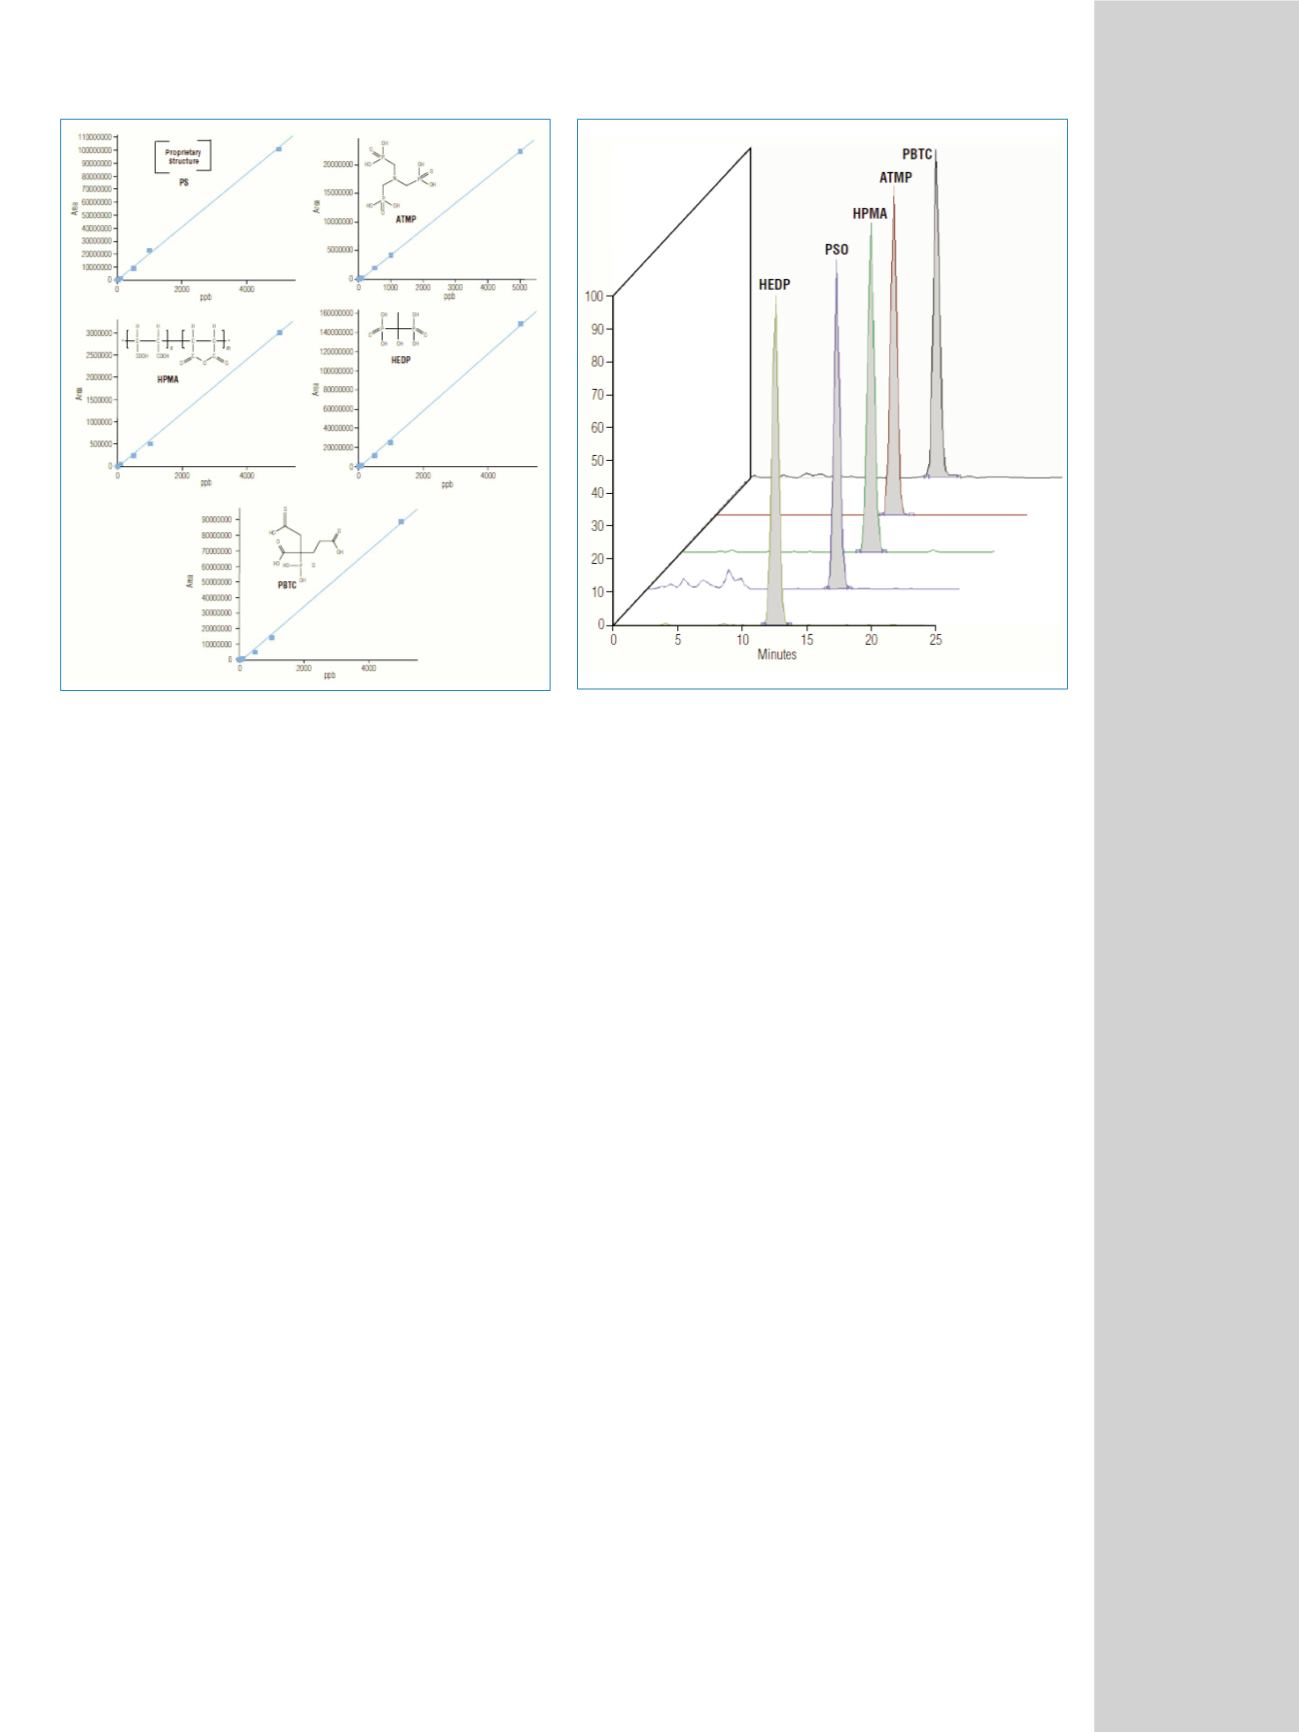
Figure 2. Calibration curves from 5 ppb to 5000 ppb for the analytes of
interest, determined by linear regression analysis with equal weighting of
the data.
Figure 3. The response of 100 ppb analytes spiked into a high ionic strength
matrix. The analytes showed excellent recoveries (within 15% of the
100 ppb spike) when spiked into the matrix.