


 255 / 302

3
Thermo Scientific Poster Note
•
PN63560_E 06/12S
retardants (BFRs) and
Both BFRs and OCs
s. Therefore, detection
is developed to
ectrometry (LC-MS).
o reduce sample
e quadrupole (TSQ)
e linear ion trap were
ves for the TSQ method
ther study.
in various industries
cted in the biosphere.
s, the most infamous of
ited States, their use
and OCs, as well as
ctivity therein, makes
topic. We propose
need for
ting sample
s.
/mL to make stock
ing standards:
ppb. Kepone was
iked and un-spiked
ation.
ear ion trap mass
ode, with a grid voltage
were acquired for all
ionization, and obtain
ce was run in direct
MAX triple stage
n the TSQ Quantum
1D transmission mode,
ired on the LTQ™
rature 270 ºC, tube lens
ted reaction monitoring
ith the following
RM data was acquired
re of 1.5, with
he full scan sensitivity
s with an average
ART-SVP in 1D
re detected and
MS/MS spectra were
Figure 2). Confirmation
e DART-SVP in direct
FIGURE 1. Caption is Arial 13 pt Bold. The caption is always positioned above
the figure. Figures no longer have a visible box around them. Always leave at
least one line of space between the last line of the caption and the figure.
Always leave space between the figure caption and the vertical rule to the right.
Do not change the width of the caption box unless you are putting figures side
by side.
Figures spanning multiple columns are forbidden. Each column is
over a foot wide when printed full size. If a figure has so much detail that it
needs to be more than two feet wide to be readable, no one is going to have the
time to read all that detail anyway.
FIGURE 5. Caption.
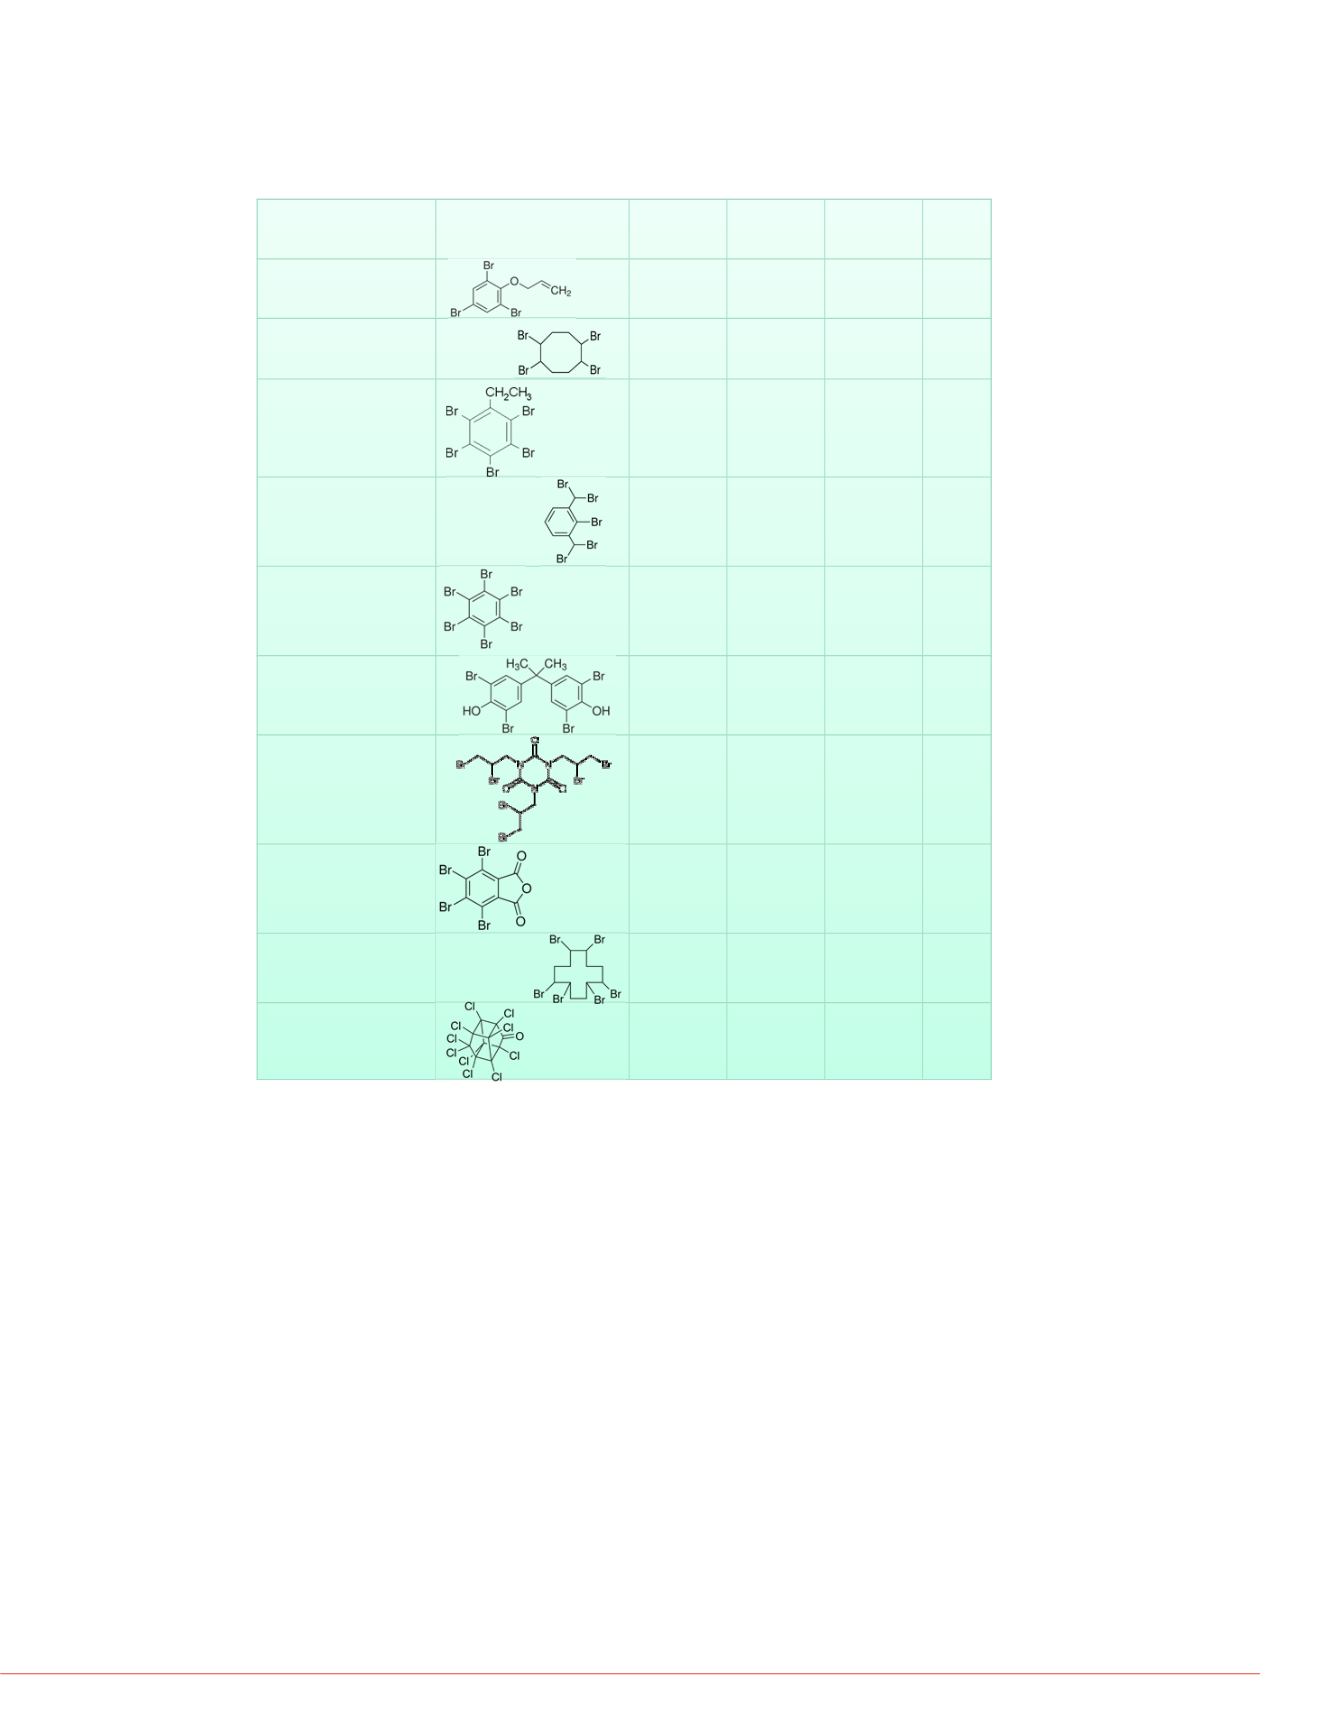
Compound
Molecular Structure
Formula
Theoretical
monoisotopic (most
intense isotope)
m/z
Observed precursor
for MS/MS and
proposed ionization
mechanism
Fragments
(monitored
SRM
transitions)
allyl 2,4,6-tribromophenyl
ether*
C
9
H
7
Br
3
O 367.8 (369.8)
306.9
[M+OH-HBr]
-
C
9
H
7
Br
2
O
2
265.8
1,2,5,6-tetrabromo
cyclooctane*
C
8
H
12
Br
4
423.8 (427.8)
459.6
[M+O
2
]
-
C
8
H
12
Br
4
O
2
Weak
fragmentation
2,3,4,5,6-
pentabromoethylbenzene
C
8
H
5
Br
5
495.6 (499.63)
436.7
[M+OH-HBr]
-
C
8
H
5
Br
4
O
81.0, 274.7,
356.6
2-bromo-1,3-
bis(dibromomethyl)benzene
C
8
H
5
Br
5
495.6 (499.6)
370.8
[M+O+OH-2HBr]
-
C
8
H
4
Br
3
O
2
79.0, 81.0,
326.7
hexabromobenzene
C
6
Br
6
545.51 (551.5)
486.5
[M+OH-HBr]
-
C
6
Br
5
O
378.0, 380.0
tetrabromobisphenol A
C
15
H
12
Br
4
O
2
539.8 (543.8)
542.8
[M-H]
-
C
15
H
11
Br
4
O
2
290.8, 417.8,
419.8
tris(2,3-
dibromopropyl)isocyanurate
C
12
H
15
Br
6
N
3
O
3
722.6 (728.6)
727.5
[M-H]
-
C
12
H
14
B
r6
N
3
O
3
79.0, 81.0
tetrabromophthalic
anhydride*
C
8
Br
4
O
3
459.7 (463.7)
398.7
[M+OH-HBr]
-
C
8
Br
3
O
4
326.8, 354.8
1,2,5,6,9,10-
hexabromocyclododecane
C
12
H
18
Br
6
635.7 (641.6)
640.62
[M-H]
-
C
12
H
17
Br
6
79.0, 81.0
kepone
C
10
Cl
10
O 485.7 (489.7)
506.8
[M+OH]
-
C
10
Cl
10
O
2
H
424.8, 426.8
TABLE 1. Compounds analyzed with structures, formulas, proposed ionization
mechanisms, observed precursors, and monitored SRM transitions. All precursor
masses detected by the linear ion trap were confirmed on the triple stage
quadrupole with DART-SVP infusion. Compounds marked with an asterisk were
not detected initially but were seen with DART-SVP infusion.
Direct infusion was achieved by connecting an electrospray needle via peek tubing to a
syringe pump. The needle was held by forceps in a multi-positional clamp. The needle
was then positioned directly between the DART-SVP source and the ceramic capillary
interfaced with the mass spectrometer. Compounds were infused at rates ranging from
1 to 5 µL/min and a concentration of 100 ppm. The infusion studies showed that the
compounds required higher DART-SVP source temperatures for optimum ionization
than were initially utilized. The optimum temperature was determined to be 400 ºC. The
results of the infusion studies shown in Figure 1 confirm the linear ion trap MS data. It
also shows it was possible to ionize the three compounds that were not initially
observed on the linear ion trap MS due to the DART-SVP source temperature being too
low.
It is interesting to note that the results shown in Figure 1 demonstrate a pattern in the
ionization pathway of the molecules. Compounds containing a hydrogen bonded to a
non-aromatic carbon, such as tetrabromobisphenol A, tended to lose a proton to form
the [M-H]
-
species. Alternatively, compounds containing no hydrogen atoms or
hydrogen bonded to an aromatic carbon tended to add OH
-
and lose HBr.
In addition to optimizing precursor detection the DART-SVP infusion method was used
to determine
:
tube lens values, fragment ions and CE breakdown curves for the
quantitative experiments on the TSQ MS. In the process of acquiring the CE
breakdown curves it was noted that the fragments differed from those observed in the
linear ion trap, as shown in Figure 2. This is not surprising as the fragmentation in the
TSQ MS is more energetic than that in the linear ion trap MS.
allyl 2,4,6-tribromophenyl ether
300
305
310
315
m/z
0
20
40
60
80
100
0
20
40
60
80
100
RelativeAbundance
306.61
304.93 308.71
301.01
310.11 312.84 317.04
306.88
304.89
308.88
309.95 313.00
NL:
1.50E5
2-4-6--tribromophenyl-allyl-
ether#30-54 RT: 0.26-0.46
AV: 25T: -pNSIQ1MS
[217.070-517.000]
NL:
1.06E4
C
9
H
7
Br
2
O
2
:
C
9
H
7
Br
2
O
2
p(gss, s/p:40)Chrg-1
R:
500Res.Pwr.@FWHM1,2,5,6-t
454
456
0
20
40
60
80
100
0
20
40
60
80
100
RelativeAbundance
45
455.59
4
455.76
2-bromo-1,3-bis(dibromomethyl)benzen
e
366 368 370 372 374 376 378
m/z
0
20
40
60
80
100
0
20
40
60
80
100
RelativeAbundance
370.61 372.71
368.79
374.67
375.58
365.36
379.29
370.78 372.77
368.78
374.77
375.85 377.88
NL:
7.51E5
2-Br-1-3-bis-dibromomethyl-
benzene#225-292 RT:
3.84-4.99 AV: 68T: -pNSI
Q1MS [299.070-699.000]
NL:
8.16E3
C
8
H
4
Br
3
O
2
:
C
8
H
4
Br
3
O
2
p(gss, s/p:40)Chrg-1
R:
600Res.Pwr.@FWHMhexabro
480
0
20
40
60
80
100
0
20
40
60
80
100
RelativeAbundance
482.5
480.62
482.5
FIGURE 1. TSQ full scan infusion
spectra for observed precursors d
mechanisms. Top spectrum in eac
theoretically generated spectrum
Panel B of Figure 2 depicts a spectru
the auto-tune procedure in which the
the most intense fragments are auto
Quantitative experiments
After the infusion experiments, the 1
was installed. Kepone was selected
ionization, and spiked into all sample
free run mode with a constant rail sp
generate the best approximation of G
spiking that can occur when the rail
The results of calibrators and sample
signal from a single spot. Each chro
one pass through the 10-spot rail. 5
horizontal line through the center of t
total application of 10 µL. Several of t
specifically tetrabromobisphenol A, 1,
tris(2,3-dibromopropyl)isocyanurate.
poor. It was determined that each co
possible to normalize responses with
reproducibility was most likely a funct
have been compensated for by the u
given the variation in response from
quantitative information. Peak areas f
FIGURE 2. MS/MS Spectra for tetra
trap data, Panel B depicts triple qu
a normalized collision energy of 3
stepped collision energy in the aut
A
B
542_8
_BFRs_225C_008 # 13-14 RT: 0.11-0.11
AV:
2
NL:
5.27E
T:
I MS
-pNSIFullms2542.80@cid35.00 [145.00-550.00]
150
200
250
0
5
10
15
20
25
30
35
40
45
50
55
60
65
70
75
80
85
90
95
100
RelativeAbundance