


 250 / 302

Mass Spectrometry
MS analysis was carried out on a Thermo Scientific
TSQ Quantum Access triple stage quadrupole mass
spectrometer with an electrospray ionization (ESI) source.
The MS conditions were as follows:
Ion source polarity:
Negative ion mode
Spray voltage:
4000 V
Sheath gas pressure:
40 arbitrary units
Ion sweep gas pressure: 1 arbitrary unit
Auxiliary gas pressure: 2 arbitrary units
Capillary temperature: 300 °C
Collision gas pressure: 1.2 bar
Skimmer offset:
0 V
Detection mode:
Selective reaction monitoring
(SRM); see Table 1 for details.
The cooling water matrix ions eluted prior to the analytes;
therefore, the first 7.5 minutes of elution were diverted
from the mass spectrometer to decrease source fouling.
While the eluent was diverted, a make up flow of
methanol was supplied to the mass spectrometer.
Table 1. SRM conditions
Name
SRM
Collision
Scan
Scan
Tube
Transitions
Energy (V) Width (Da) Time (s) Lens (V)
HEDP 204.580
→
168.860
16
0.01
0.5 49
204.580
→
186.855
13
PBTC 268.910
→
188.925
20
0.01
0.5 45
268.910
→
206.911
16
ATMP 297.770
→
197.896
26
0.01
0.5 54
297.770
→
215.870
20
PSO* 296.850
→
118.749
27
0.01
0.5 34
296.850
→
146.832
19
HPMA 337.490
→
318.829
16
0.01
0.5 60
318.960
→
230.997
13
*PSO is a proprietary molecule. For this oligomer, m/z 296.85 was found to
be a consistent marker ion.
Results and Discussion
Calibration curves generated on the TSQ Quantum
Access
™
mass spectrometer show excellent linearity using
only external quantitative measurements with no internal
standard correction. The detection range for all
compounds was 5-5000 ppb (Figure 2 and Table 2).
The method detection limit (MDL) in matrix was
calculated by seven replicate injections of 100 ppb in a
simulated matrix of fluoride (20 ppm), chloride (30 ppm),
nitrate (100 ppm), phosphate (150 ppm), and sulfate
(150 ppm). Using the equation
MDL= t
99%
× S
(n-1)
, where
t
equals the Student’s
t
test at 99% confidence intervals
(t
99%
,
(6)
= 3.143
) and
S
is the standard deviation, the
MDLs for all compounds were calculated (Table 2).
Figure 3 shows the response of the analytes spiked in the
simulated matrix. The recoveries of all of the compounds
were within 15% of the 100 ppb spike. The
reproducibility of all the matrix-spiked samples was
within 5%, without internal standard correction.
Table 2. Linearity and calculated detection limits of the analytes
Compound
R
2
MDL in matrix (ppb)
HEDP
0.9979
8.3
PBTC
0.9975
3.7
ATMP
0.9998
16.5
HPMA
0.9985
16.5
PSO
0.9965
8.8
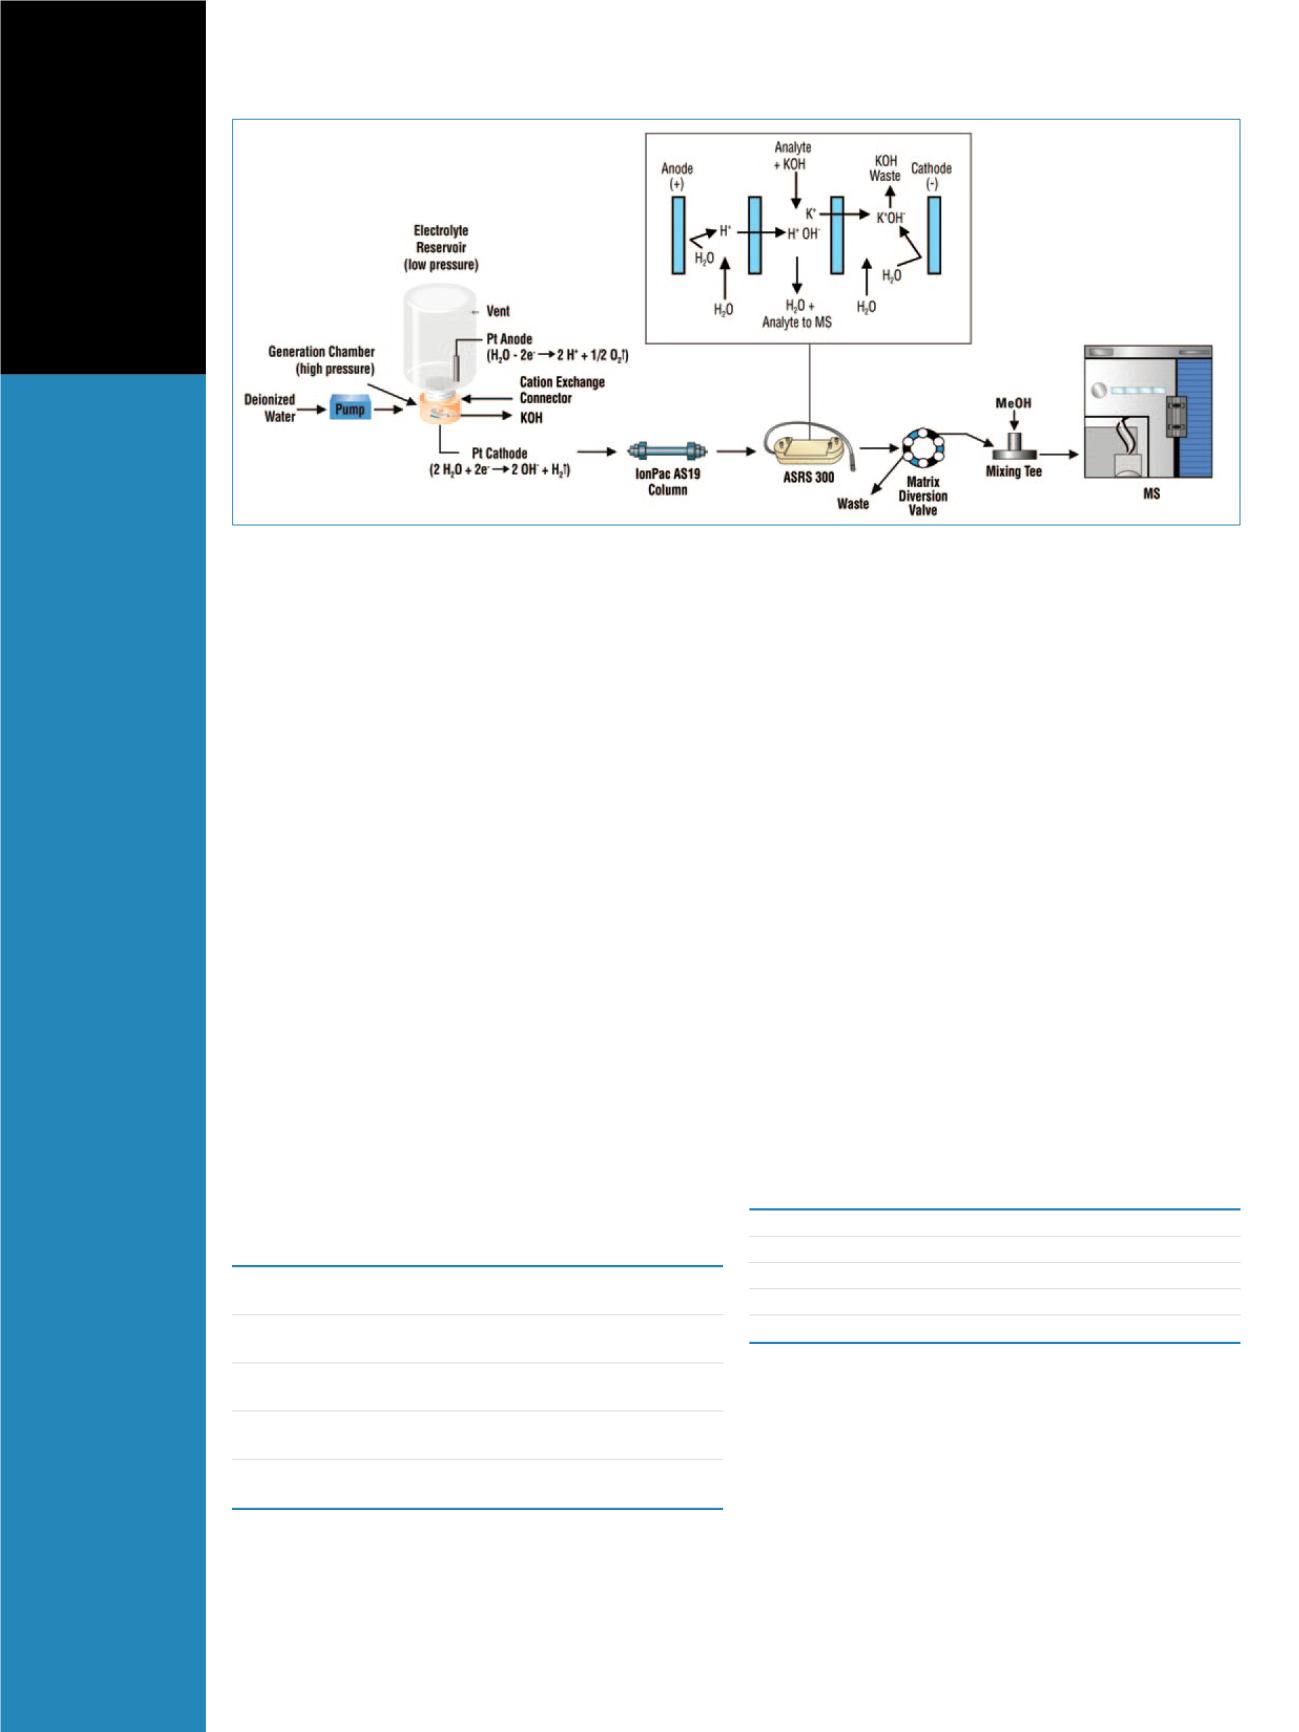
Figure 1. The flow schematic for an IC-MS application shows how an eluent generator cartridge produces potassium hydroxide. The eluent then passes
through a suppressor, making it compatible with a mass spectrometer.