


 247 / 302

5
Method Performance on Seawater Samples
Calibration curves were produced by plotting the peak
area ratio (analyte/isotopically labeled surrogate) against
the concentration of each analyte, from the injection of
seven standard solutions run in triplicates. The
concentration ranges in artificial seawater varied from
0.5 to 20 µg/L and 2.5 to 30 µg/L for DOSS and
2-butoxyethanol, respectively. Linearity was observed for
both analytes in the range used (R
2
> 0.995). Since there
was no extraction or clean-up step in the analysis of
seawater, the quantitation of DOSS was performed
directly from the DOSS/DOSS-
13
C
4
peak area ratio.
DDS-
2
H
25
was added to match the matrix to that of the
calibration curves, as this compound is necessary for
quantitation in crude oil. However, the use of the DOSS/
DDS-
2
H
25
peak area ratio for quantitative purposes in
seawater yielded very similar results, suggesting that
DDS-
2
H
25
could also be used as a suitable surrogate if the
isotopically labeled DOSS is unavailable or is prohibitely
expensive.
To calculate the method detection limits (MDL) for the
target analytes, seven replicates of seawater samples were
spiked at concentrations of 4.53 µg/L for DOSS and
23.3 µg/L for 2-butoxyethanol. The MDLs were calculated
according to procedures outlined by the EPA.
8
The results
are shown in Table 2. Excellent recoveries were obtained
from fortified seawater samples, and the method is
adaptable to other matrices like crude oil.
The EPA has listed aquatic life benchmarks of 165 µg/L
for 2-butoxyethanol and 40 µg/L for DOSS and has
suggested reporting limits for environmental analysis of
125 µg/L and 20 µg/L, respectively.
9
The detection limits
reported in this work for 2-butoxyethanol (2.36 µg/L) and
DOSS (1.34 µg/L) are well below the required reporting
limits and are suited for environmental monitoring.
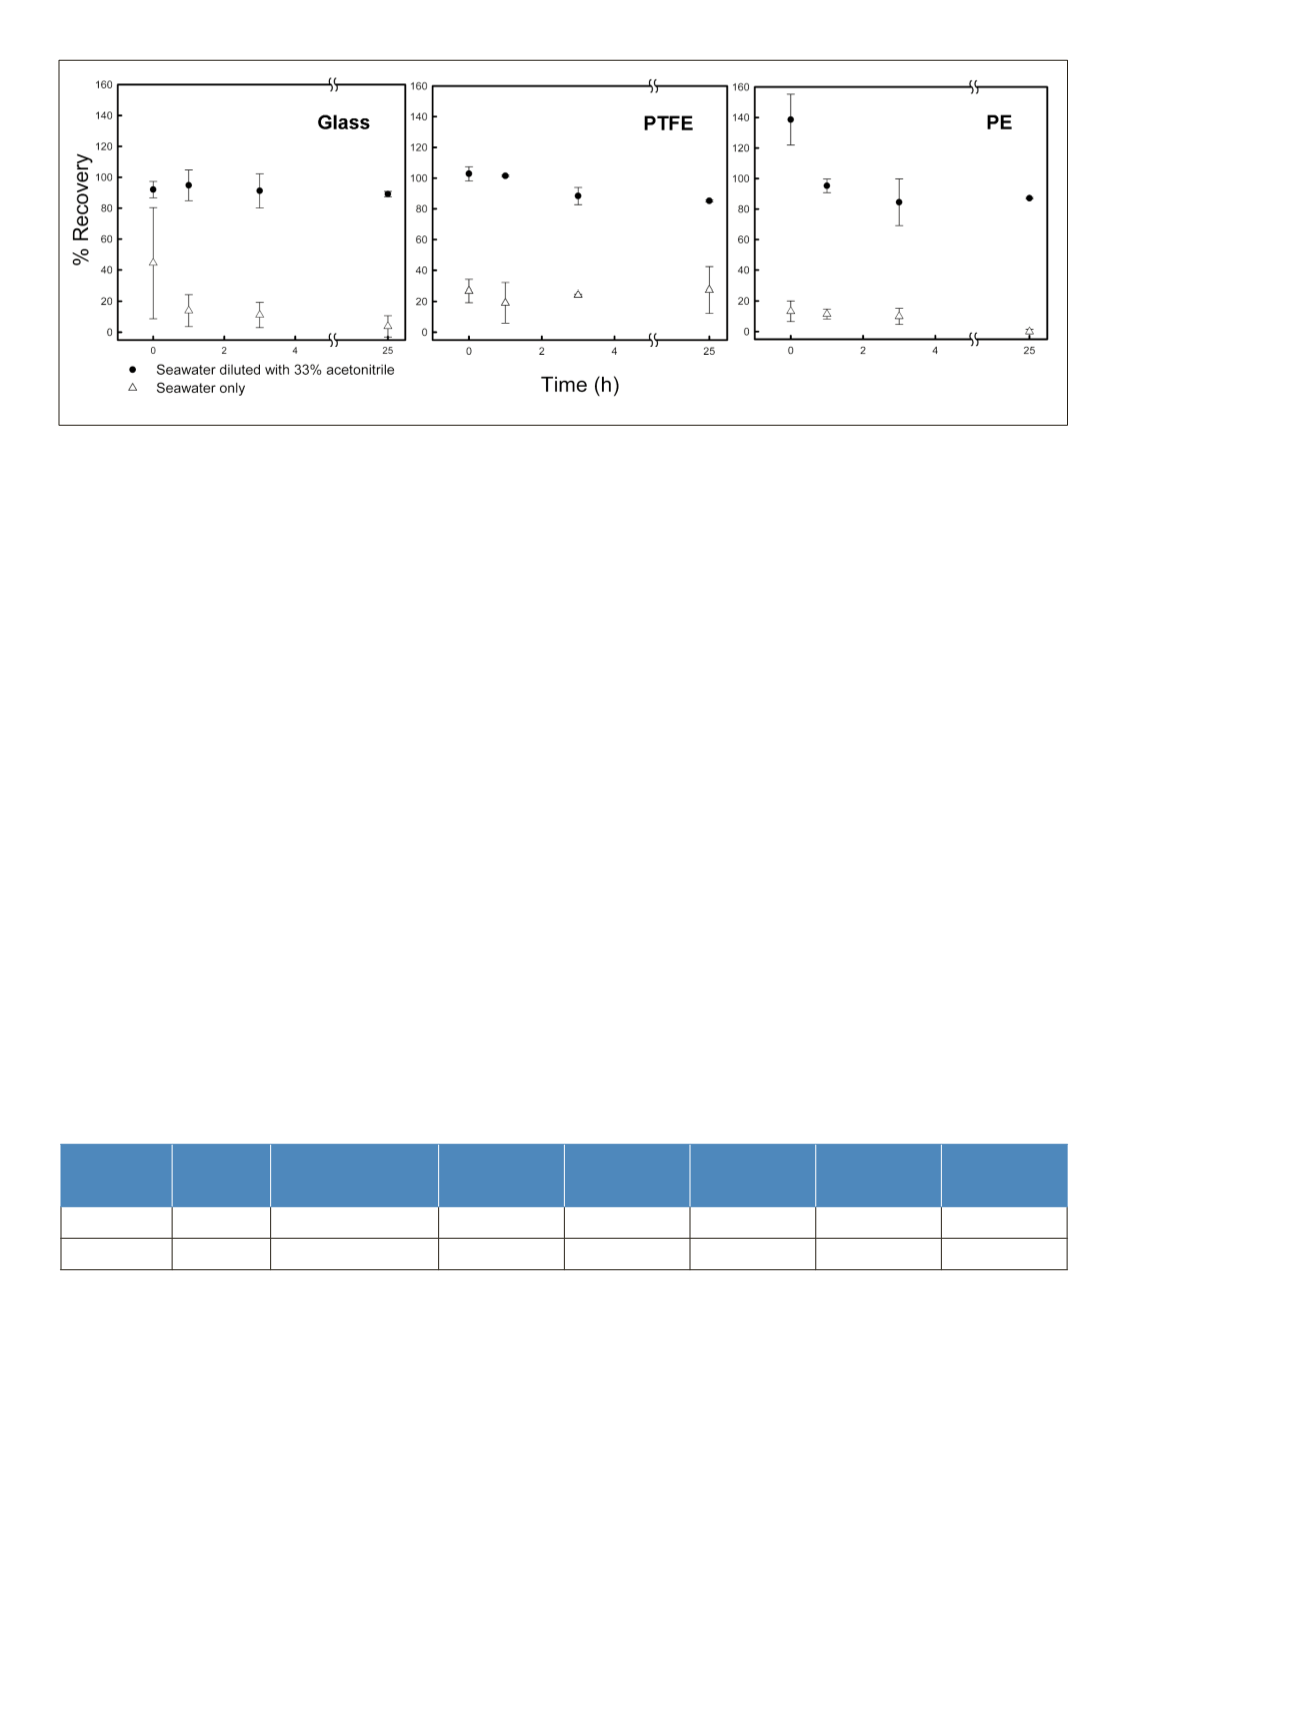
Figure 6. Glass, PTFE, and PE bottles effect on the recovery of 5 µg/L DOSS from seawater samples and acetonitrile-diluted seawater
samples
Table 2. Method detection limits and recovery in fortified seawater and light-sweet crude oil from the Wilcox formation in Texas. Water
fortification levels were 23.7 and 4.53 µg/L for 2-butoxyethanol and DOSS, respectively. For the Wilcox formation crude oil, fortification
levels were 16.8 and 2.45 mg/kg.
Matrix
Type
Unit
2-Butoxyethanol
MDL
*
Mean
Average %
Recovery
DOSS
MDL
Mean
Average %
Recovery
Seawater
µg/L
2.36
22.4
96 ± 3
1.34
4.44
98 ± 9
Crude Oil
mg/kg
4.46
17.5
104 ± 8
0.723
2.26
92 ± 9
*
Method detection limit (MDL = 3.143 x SD), n=7