


 271 / 302

3
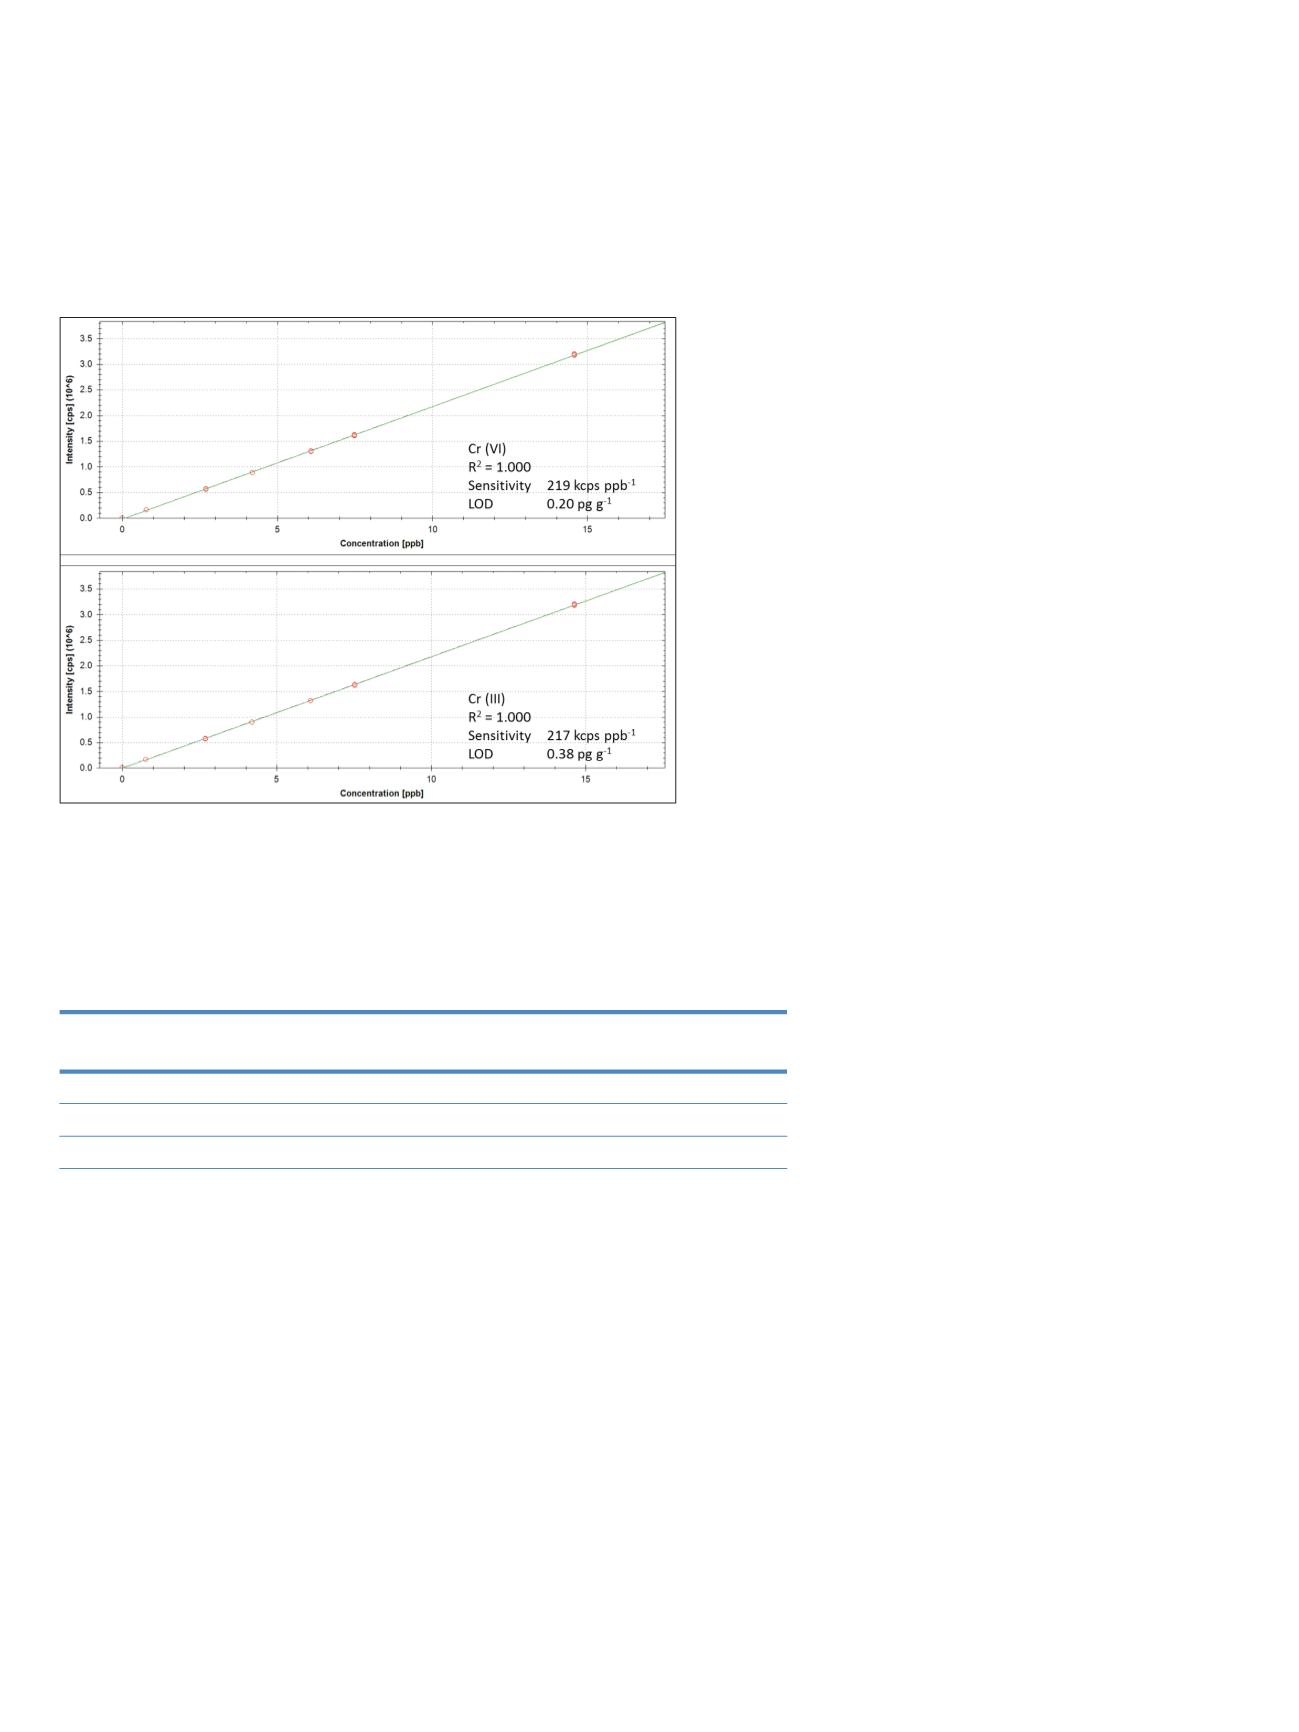
In order to determine the effect of any degradation of
Cr (VI) to Cr (III) at these conditions, a linear calibration
between 0.75 ng/g and 15 ng/g of each species was
performed. The resulting calibration curves are shown in
Figure 2. As can be seen, the detection sensitivity was
determined to be 220 kcps / ng/g for both species,
showing them to be unaffected by the HNO
3
matrix used.
Detection limits (LOD) of 0.20 pg/g for Cr (VI) and 0.38
pg/g for Cr (III) were calculated from these calibrations.
Figure 2: Calibration graphs for Cr (VI) and Cr (III).
As additional proof of the effectiveness of the proposed
chromatographic separation, mixtures of both species
were quantified against these calibrations in a spike
recovery test. Each sample was analyzed in triplicate. The
results obtained are shown in Table 3:
These values indicate that recovery for both species is
quantitative and therefore both species reach the plasma
in their original chemical form. Furthermore, the achieved
precisions indicate the excellent stability of the
chromatographic separation.
In a second experiment, the reproducibility of the method
was investigated. For routine analysis, retention times and
peak areas should remain constant to avoid repeated
calibration blocks. To test this, a mixture of both species
with a concentration of 5 ng/g was repeatedly injected
into the LC system over 2.5 h (20 individual injections).
Stabilities of < 1.5 % for retention time and < 0.3 % for
peak area were obtained (Figure 3).
Conc. spiked [ng/g]
Cr (VI)
Cr (III)
Found (ng/g) Recovery (%)
Found (ng/g) Recovery (%)
2.34 of each
2.31 ± 0.01
99 ± 1
2.35 ± 0.02
100 ± 1
6.03 Cr (VI); 1.90 Cr (III)
6.01 ± 0.02
100 ± 1
2.00 ± 0.01
105 ± 1
1.87 Cr (VI); 6.20 Cr (III)
1.85 ± 0.01
99 ± 1
6.15 ± 0.03
99 ± 1
Table 3: Recovery of Cr (VI) and (III) species