


 235 / 302

5
MCAA
DCAA
TCAA
2 µg/L spiked
tap water
2 µg/L laboratory
fortified matrix
2 µg/L spiked
tap water
2 µg/L laboratory
fortified matrix
2 µg/L spiked
tap water
2 µg/L laboratory
fortified matrix
Blanks (tap water
or ultrapure water)
0.282
NF
3.346
NF
3.603
NF
n=5
(quantitation
value)
2.090
1.910
5.215
1.894
5.656
1.894
2.116
1.885
5.363
1.902
5.584
1.954
2.145
1.834
5.372
1.881
5.686
1.907
2.144
1.939
5.325
1.836
5.603
1.890
2.146
1.863
5.330
1.871
5.632
1.860
Average value
2.128
1.886
5.321
1.877
5.632
1.901
Average value
minus blank value
1.846
1.886
1.975
1.877
2.029
1.901
Recovery level
92%
94%
99%
94%
101%
95%
%RSD
1.2%
2.2%
1.2%
1.4%
0.7%
1.8%
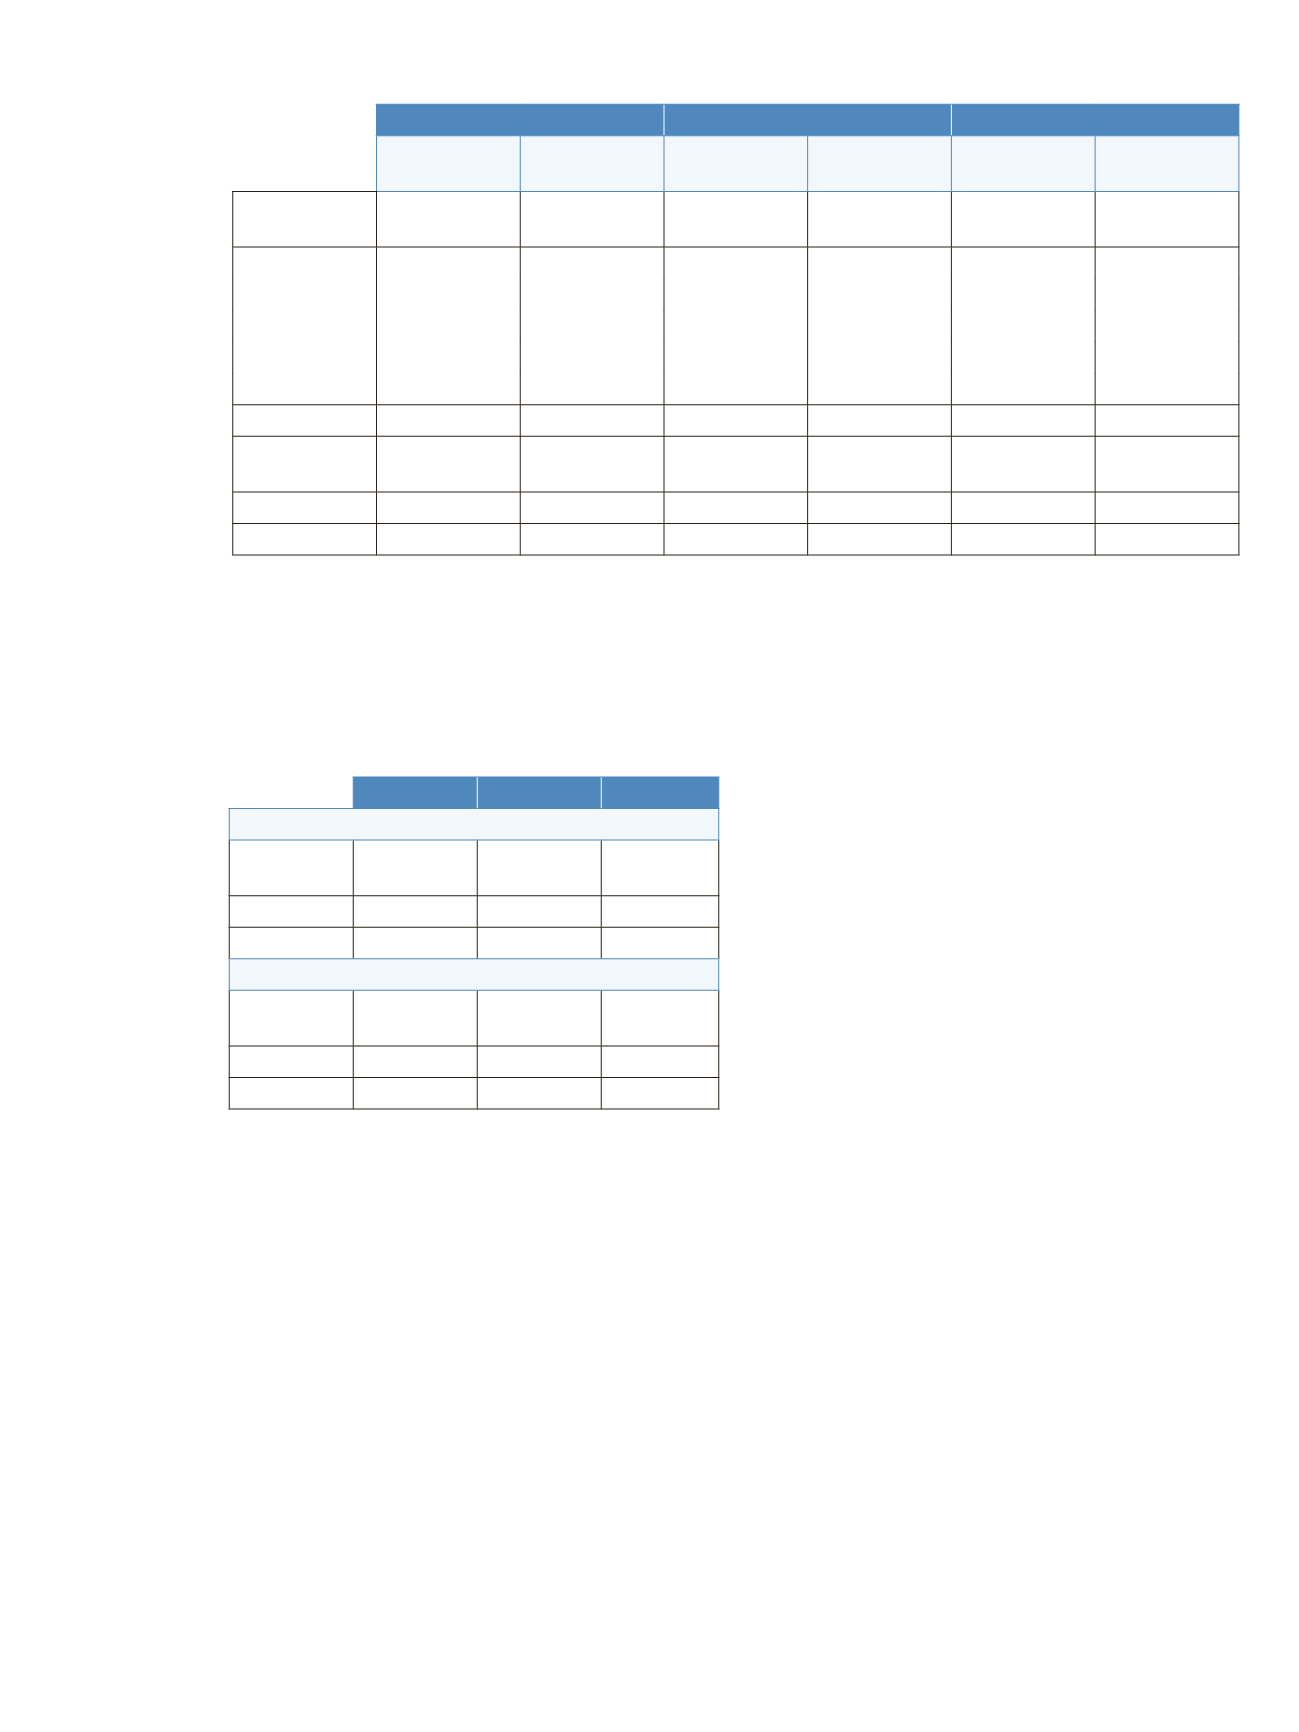
Table 3. Recovery levels in 2 µg/L of spiked tap water and 2 µg/L of added laboratory fortified matrix
Accuracy and Precision
Five replicates were quantitated for spiked tap water
samples (two concentrations) using a calibration curve
created from the five tests. The average recovery level and
%RSD for each set of replicates are reported in Table 4.
Table 4. Parallel test results
*The average concentration was calculated using the value after
subtracting the blank concentration.
Conclusion
A highly sensitive LC-MS/MS method for measuring
haloacetic acids using a dedicated Acclaim HAA HPLC
column has been established. Under these analysis
conditions, the ionization-inhibiting chloride ions, nitric
acid ions, sulfuric acid ions, and haloacetic acids can be
separated, making it possible to perform reliable
measurements even when interfering anions are not
removed using an SPE cartridge or alternative sample
preparation. In addition, reproducible results were
obtained for samples at concentrations more than ten
times lower than regulated amounts. Accuracy and
precision in tap water was confirmed in repeated testing.
MCAA
DCAA
TCAA
20 µg/L of spiked tap water
Average
concentration*
19.53
18.48
19.26
Recovery level
98%
91%
95%
%RSD
2%
1%
2%
2 µg/L of spiked tap water
Average
concentration*
1.82
1.96
2.16
Recovery level
91%
98%
108%
%RSD
4%
3%
6%