


 234 / 302

4
Confirmation of Recovery Level
A spike recovery test was performed for the tap water
sample spiked with standards to 2 µg/L. Good recoveries
in the range of 92% to 101% were obtained (Table 2).
The same test was performed for the spiked fortified
matrix sample and favorable results were obtained
(Table 3).
MCAA
DCAA
TCAA
Standard
2 µg/L
2 µg/L of spiked
tap water
Standard
2 µg/L
2 µg/L of spiked
tap water
Standard
2 µg/L
2 µg/L of spiked
tap water
Blanks (ultrapure
or tap water)
NF
6136
NF
2013784
NF
3602064
n=5
(area value)
33492
33192
1369465
3000890
2434743
5301570
32335
33581
1355191
3079005
2465008
5241249
32605
34016
1361893
3083660
2476721
5325868
33295
34005
1381170
3059149
2472097
5257085
33406
34025
1387243
3061388
2474253
5281431
%CV
1.6%
1.1%
1.0%
1.1%
0.7%
0.6%
Table 2. Area value reproducibility for 2 µg/L of standard product and 2 µg/L of spiked tap water
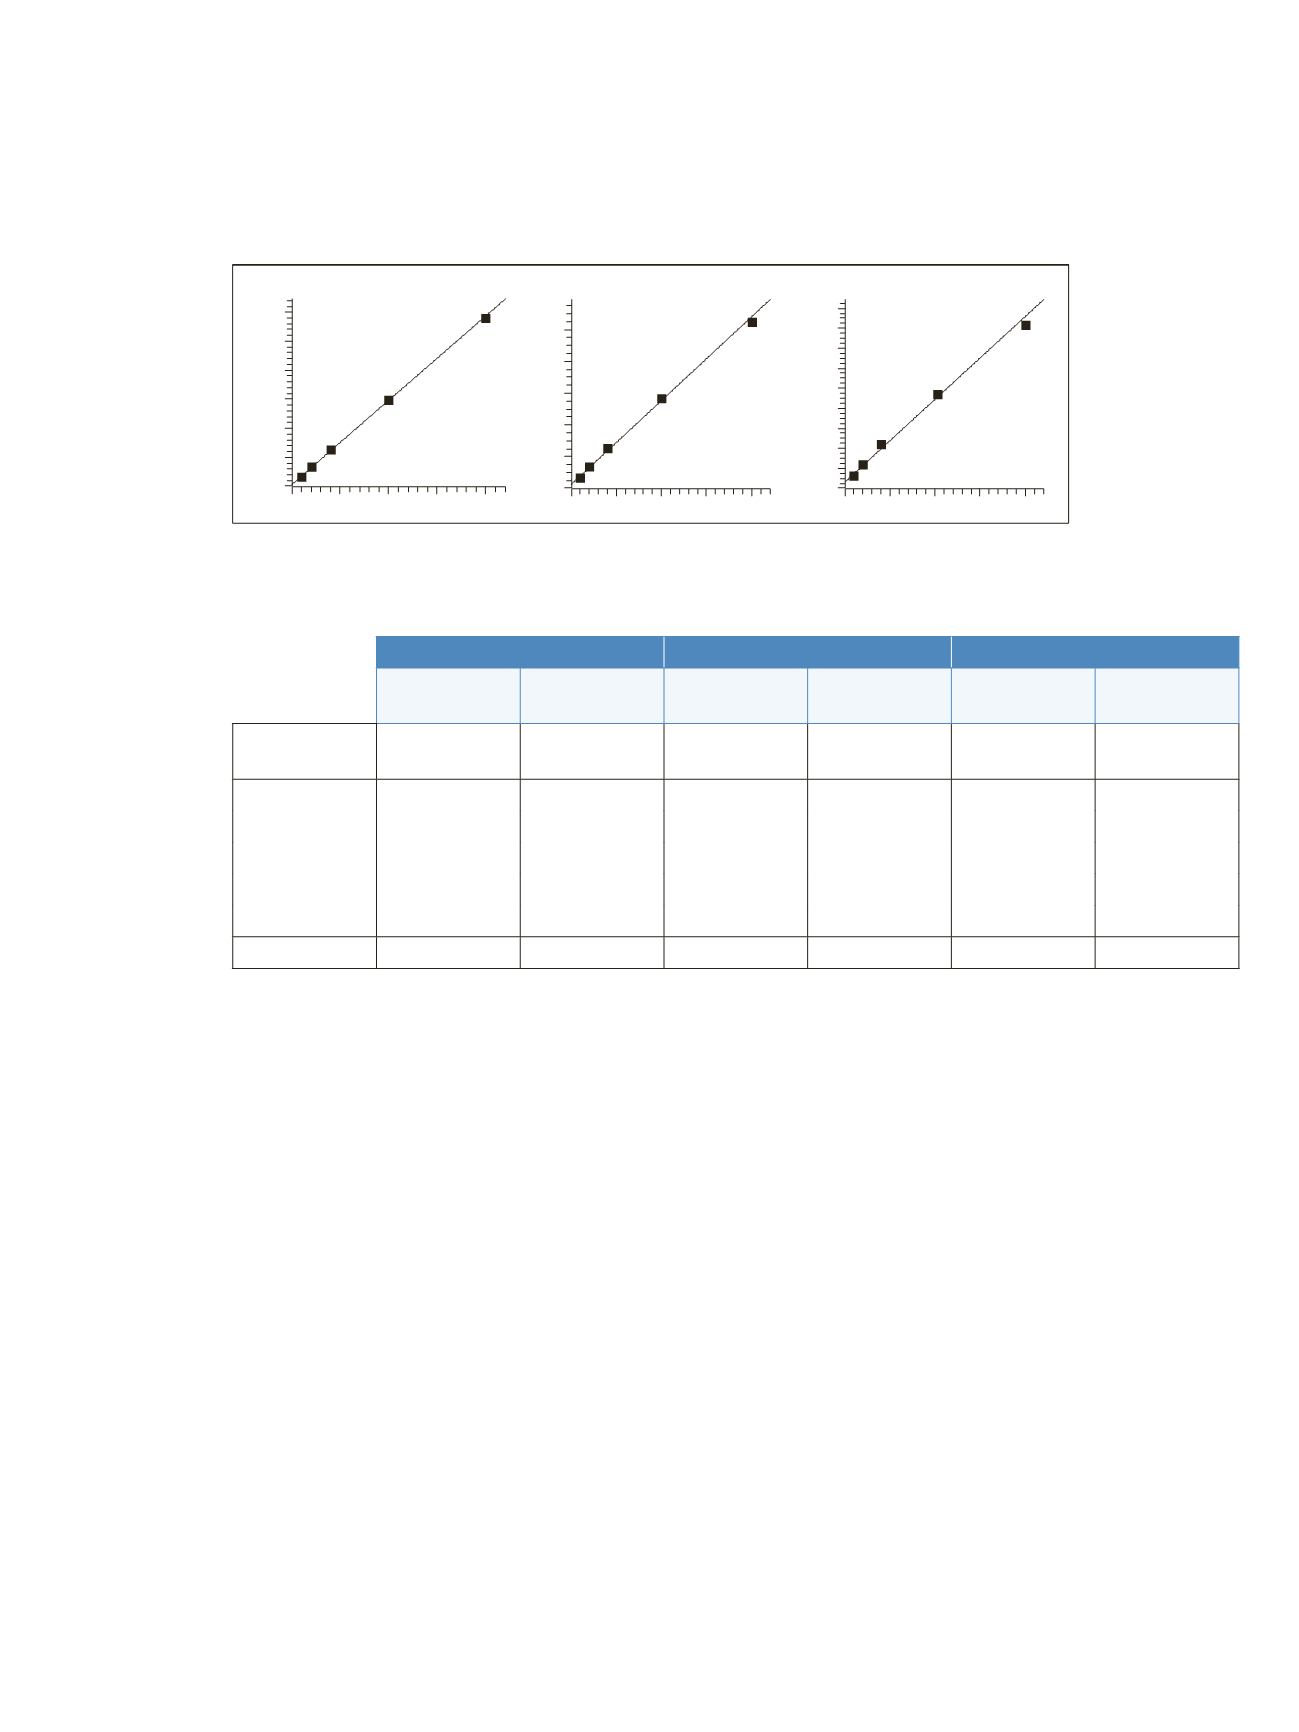
MCAA
Y = 3131.43+14503.1*X R^2 = 0.9990 W: 1/X
0
5
10
15
20
ug/L
0
50000
100000
150000
200000
250000
300000
Area
DCAA
Y = 246802+528094*X R^2 = 0.9959 W: 1/X
0
5
10
15
20
ug/L
0
2000000
4000000
6000000
8000000
10000000
Area
TCAA
Y = 620778+827509*X R^2 = 0.9916 W: 1/X
0
5
10
15
20
ug/L
0
2000000
4000000
6000000
8000000
10000000
12000000
14000000
16000000
18000000
Area
a)
b)
c)
Figure 5. Calibration curves: a) MCAA, b) DCAA, c) TCAA
Calibration Curve and Reproducibility
The calibration curves were created over a range from
1 to 20 µg/L with linearities greater than 0.99 (Figure 5).
Reproducible results were obtained for 2 µg/L of standard
solution and for tap water spiked with 2 µg/L of standard
solution. Coefficients of variation were less than 1.6%
(Table 2).