


 239 / 302

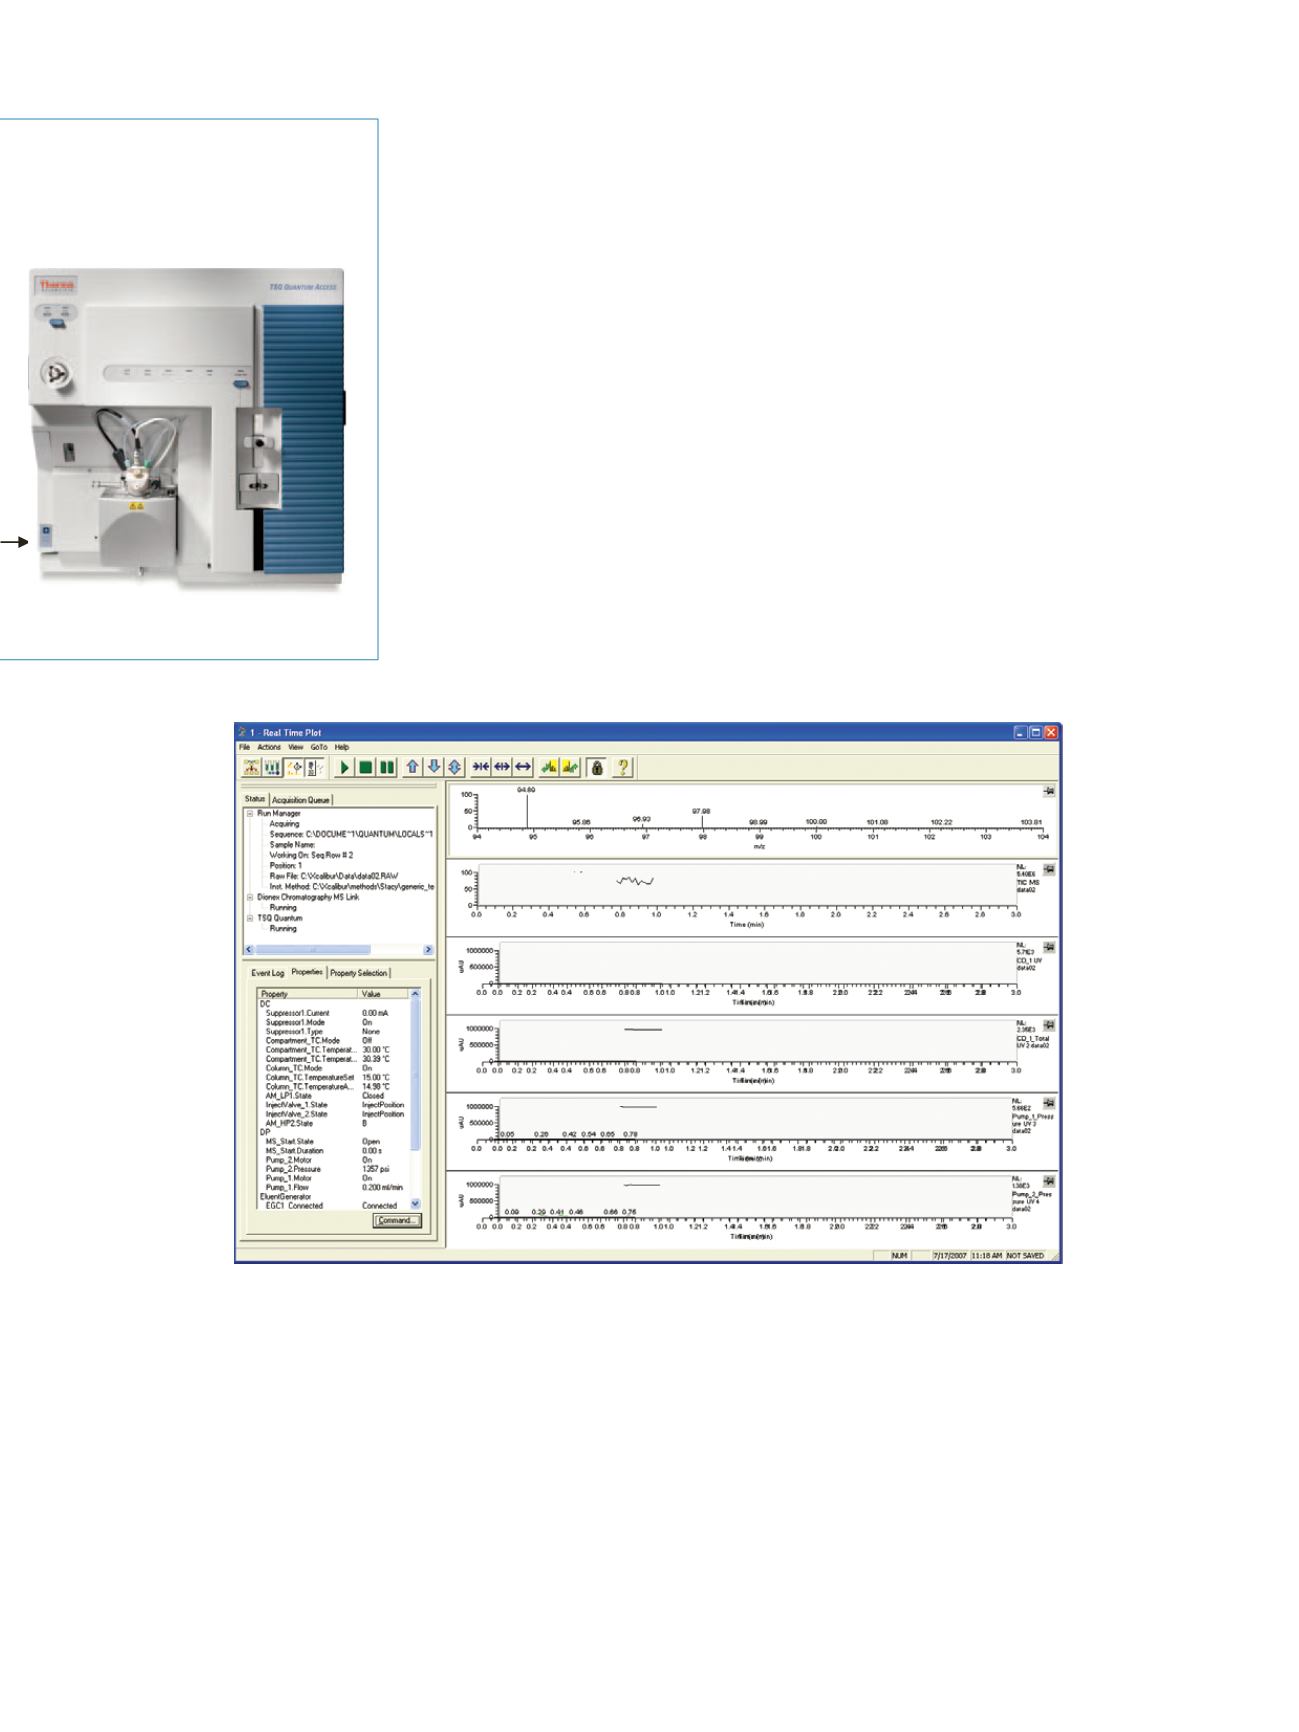
Figure 2: These chromatograms show the progress of the pump pressure and front end detector data along with the TSQ
Quantum Access MS data. The left side of the screen shows the status of the ion chromatography system and the status of
the TSQ Quantum Access.
The status of the ion chromatography system was
monitored at the same time as the MS data acquisition, as
shown in Figure 2.
Results and Discussion
The separation of the nine HAAs is shown in Figure 3.
The selectivity of the IC-MS/MS system allows separation
of the HAAs from common inorganic matrix ions. This
allows matrix peaks of chloride, sulfate, nitrate, and
bicarbonate to be diverted to waste during the analytical
run and avoids premature fouling of the ESI-MS/MS
instrument source.
An internal standard mixture of
13
C labeled MCAA,
MBAA, DCAA, and TCAA was spiked into each sample
at 3 ppb. The calibration curves were generated using
internal standard calibrations for all of the HAA
compounds in water. Excellent linearity results were
observed for all compounds as shown in Figures 4, 5, and
6. Analytes were run at levels of 250 ppt to 20 ppb. It
must be noted that the TCAA analyte could not be
detected at levels below 2.5 ppb. TCAA sensitivity is very
strongly correlated with the source temperature of the
mass spectrometer. To improve the TCAA detection, the
temperature was lowered. However, lowering the
temperature impacted the detection of the other eight
analytes. This phenomenon of TCAA temperature
sensitivity has been reported in studies with other MS
instrumentation configurations.
5
To test the recoveries of all nine HAAs, spiked matrix
samples were run in a matrix of 250 mg/L of each of
chloride and sulfate, 150 mg/L of bicarbonate, 30 mg/L of
TSQ Quantum Access
™