


 241 / 302

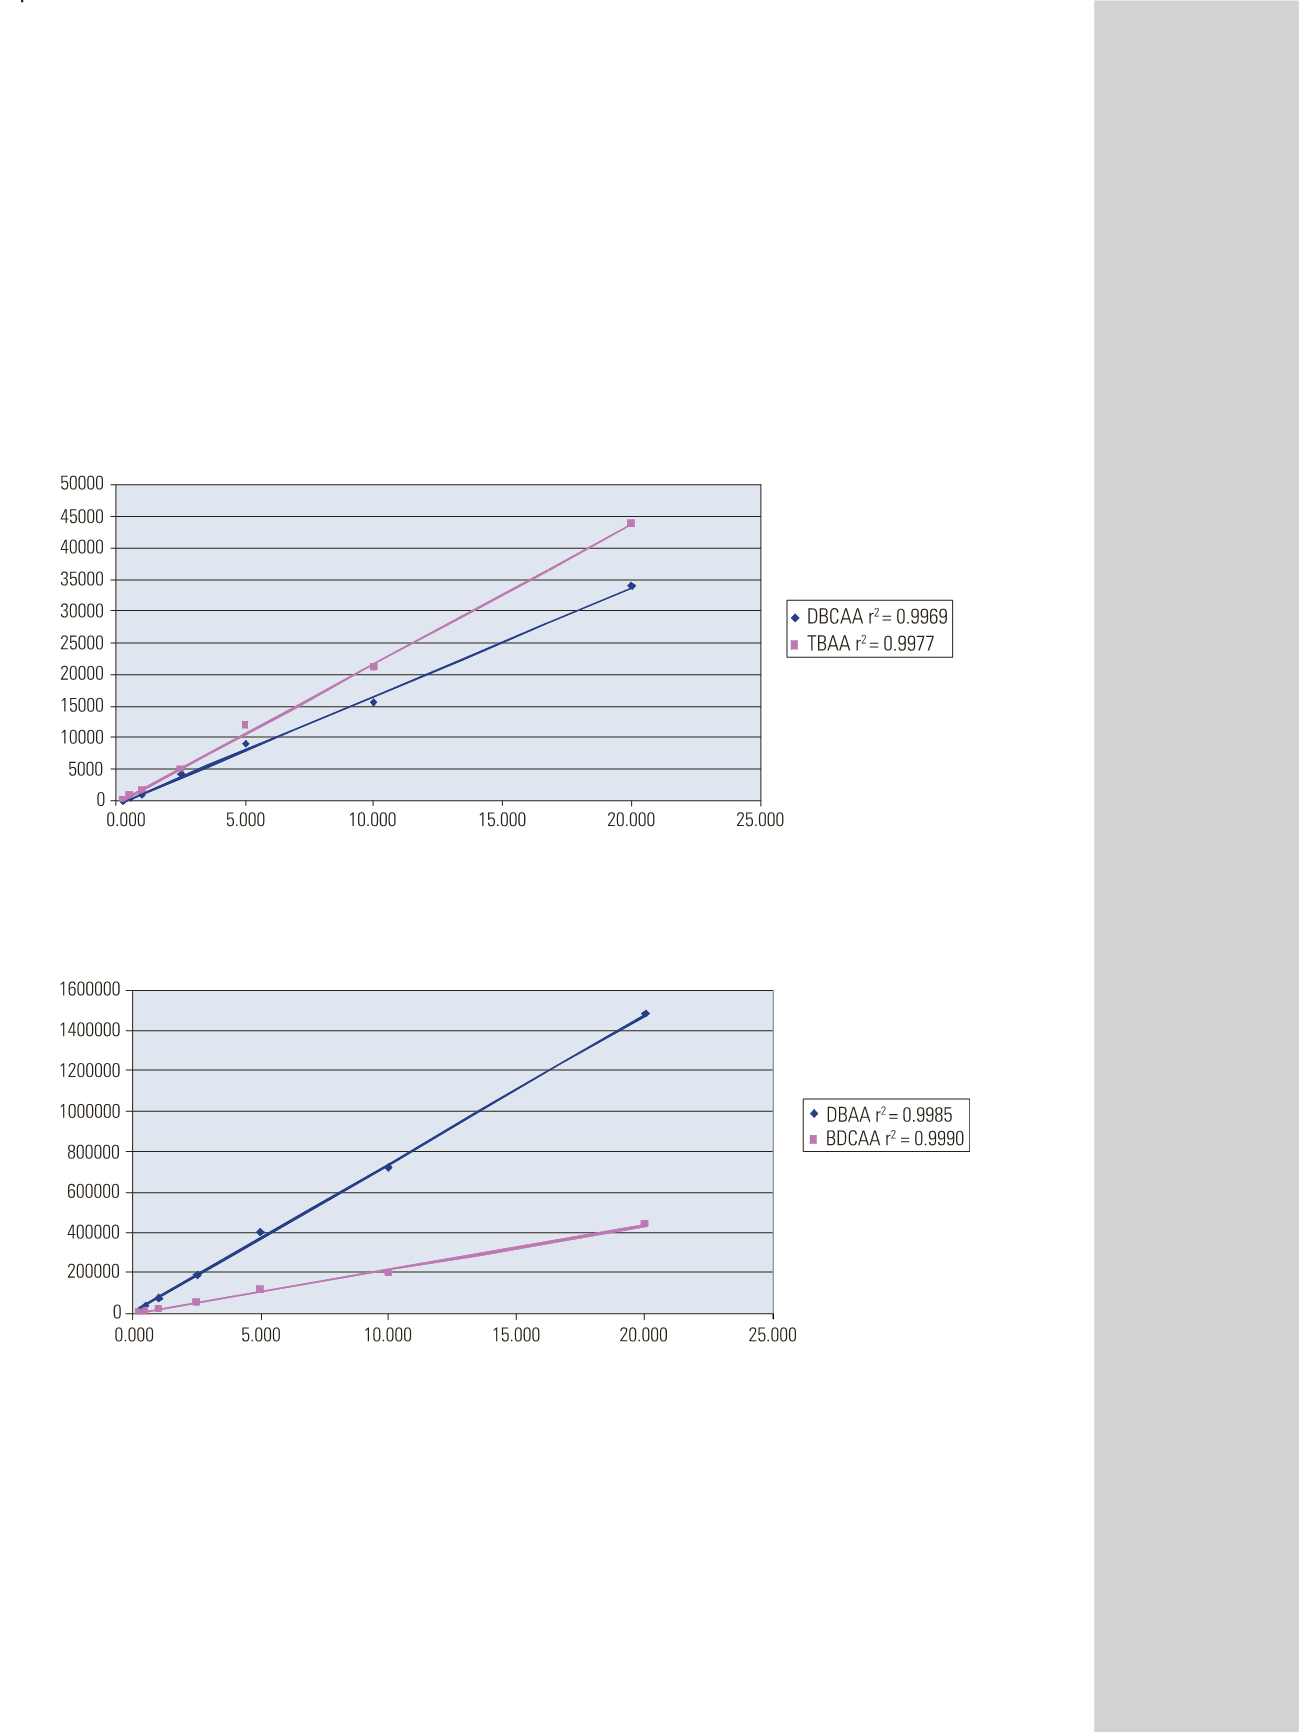
Figure 5: Overlay of calibration curves of dibromochloroacetic acid and tribromoacetic acid in water by IC-MS/MS
Figure 6: Overlay of calibration curves of dibromoacetic acid and bromodichloroacetic acid in water by IC-MS/MS
nitrate, and 100 mg/L ammonium chloride preservative,
for a total chloride concentration of 316 mg/L. The results
are shown in Table 5. Excellent recoveries and
reproducibility were achieved for most of the samples.
However, difficulty was observed when quantitating low
levels of DBCAA in matrix. DBCAA does not ionize as
strongly as the other analytes in the method and is very
susceptible to temperature changes in the column.
Method detection limits (Table 6) were calculated by
seven replicate injections of 1.0 ppb of each analyte and
the equation
MDL=t
99%
xS
(n-7)
, where: t is Student’s t at
99% confidence intervals (t
99%, n=7
= 3.143) and S is the
standard deviation. Table 6 compares these results to the
calculated MDL values of EPA Method 552.2, which uses
liquid-liquid extraction and methylation of the carboxylic
acids before determination by GC-ECD. The results
obtained by the IC-MS/MS method were comparable to
those achieved in EPA Method 552.2.