


 197 / 302

3
Thermo Scientific Poster Note
•
PN64245-RAFA 0914S
Ground water, surface water and waste water samples
were collected and prepared as described earlier
1
.
Liquid Chromatography
For chromatographic separation, a HPLC system was
used consisting of a CTC Pal autosampler (CTC analytics,
Zwingen, Switzerland) and a Rheos 2200 pump (Flux
Instruments, Switzerland). For separation a XBridge C18
column (50x2.1 mm, 3.5 µm particle size) was used,
applying a gradient of water and methanol, both acidified
with 0.1% formic acid as given in Fig. 2.
Mass Spectrometry
For mass spectrometric analysis a Q Exactive quadrupole
Orbitrap mass spectrometer was used. The final setup
was run in electrospray mode, the spray voltage being +
4000 V (positive mode) or - 3000 V (negative mode). The
capillary temperature was at 320°C. S-lens-level was set
to 50, auxiliary gas flow rate was 15 (arbitrary units) and
sheath gas flow rate was 40 (arbitrary units) for both
ionization modes.
For data dependent experiments, full scan was recorded
with a resolution of 140,000 @
m/z
200, while the data
dependent MS
2
scans were recoded with a resolution of
17,500 @
m/z
200.
For AIF experiments, full scan was recorded with a
resolution of 140,000 @
m/z
200 and the fragment
spectra were recorded with a resolution of 17,500 @
m/z
200.
For DIA experiments, full scan was recorded with a
resolution of 70,000 @
m/z
200, automated gain control
was set to 500,000 and the maximal injection time was
200 ms. After the full scan different numbers of data
independent MSMS spectra were recorded. Isolation
widths and mass ranges were set according to Fig. 3.
Resolution was set to 17,500 @
m/z
200, AGC to 200,000
and maximal injection time to 100 ms.
In DIA mode different se
assumption was that wit
resulting isolation wind
on the fragment ion sign
the smaller masses whil
shows only low amount
windows were kept sma
only one bigger window
Fig. 4).
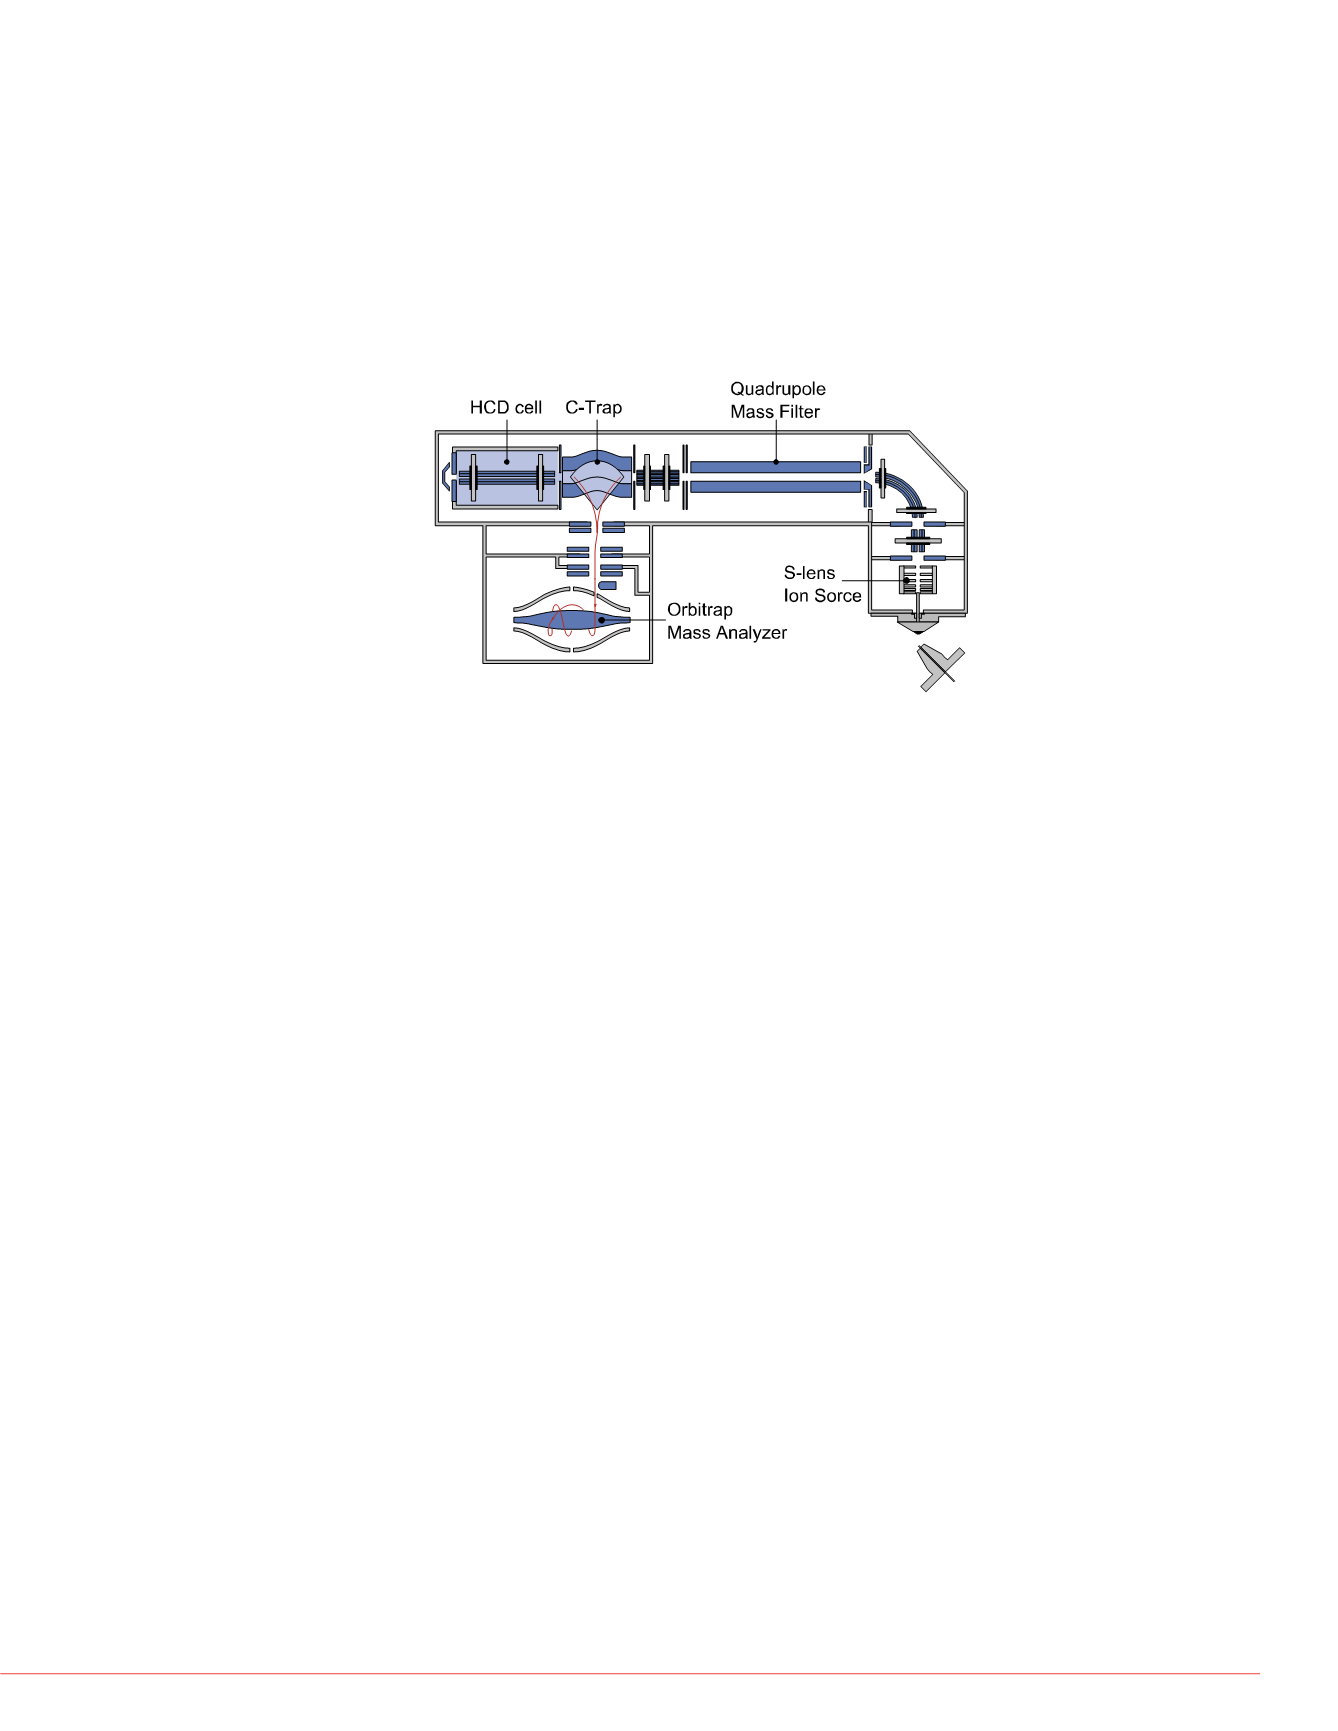
FIGURE 1. Schematics of the Q Exactive mass
spectrometer.
FIGURE 4. Isolation wi
isolation windows in D
the isolation window o
from Ref.
1
).
So in total there were ei
AIF experiment (row 1),
from
m/z
100 to 1000. T
mass rage at
m/z
450 (r
experiments subdivided
number of smaller isolat
windows, of which seve
(row 8).
FIGURE 5. Influence
the sensitivity of spe
Morphine in a neat st
RT:
0.69 -2.10
1.0
1.5
2.0
Time (min)
0
20
40
60
80
100
0
20
40
60
80
100
0
20
40
60
80
100
0
20
40
60
80
100
Relative Abundance
0
20
40
60
80
100
0
20
40
60
80
100
1.34
1.32
1.34
1.31
1.36
1.30
1.37
1.29
1.40
1.27
1.44
1.49
1.25
1.56
1.66
1.23
1.34
1.33
1.35
1.29
1.42
1.27
1.50
1.26
1.54
1.35
1.29
1.40
1.51
1.33
1.31
1.34
1.35
1.30
1.37
1.28
1.44
1.52
1.32
1.36
1.30
1.37
1.27
1.40
1.26
1.43
1.26
1.54 1.61
NL: 1.20E8
m/z=
286.1409-286.1467
F: FTMS + pESI Full
ms [100.00-1000.00]
MS 130516pos_004
NL: 0
m/z=
268.1306-268.1360
F: FTMS + pESI Full
ms2 MS
130516pos_004
NL: 2.39E6
m/z=
201.0892-201.0932
F: FTMS + pESI Full
ms2 MS
130516pos_004
NL: 1.03E6
m/z=
229.0838-229.0884
F: FTMS + pESI Full
ms2 MS
130516pos_004
NL: 2.66E6
m/z=
211.0734-211.0776
F: FTMS + pESI Full
ms2 MS
130516pos_004
NL: 3.50E6
m/z=
183.0787-183.0823
F: FTMS + pESI Full
ms2 MS
130516pos_004
RT:
0.70 -2.10
1.0
1.5
Time (min)
0
20
40
60
80
100
0
20
40
60
80
100
0
20
40
60
80
100
0
20
40
60
80
100
Relative Abundance
0
20
40
60
80
100
0
20
40
60
80
100
1.32
1.31
1.34
1.29
1.35
1.27 1.37
1.39
1.26
1.41
1.25
1.47
1.23
1.55
1.34
1.31
1.38
1.31
1.4
1.27
1.31
1.31
1.30
1.36
1.27 1.36
1.40
1.26
1.24
1.54
1
1.23
1.32
1.33
1.29
1.34
1.35
1.36
1.29
1.38
1.27
1.41
1.26
1.5
1.24
1.32
1.33
1.29 1.36
1.36
1.27
1.24
1.47 1.
1.31
1.36
1.28
1.27
1.39
1.5
1.24
1 window 2 win
Liquid Chrom togra hy
For chromatographic separation, a HPLC system was
used consisting of a CTC Pal autosampler (CTC analytics,
Zwingen, Switzerland) and a Rheos 2200 pump (Flux
Instruments, Switzerland). For separation a XBridge C18
column (50x2.1 mm, 3.5 µm particle size) was used,
applying a gradient of water and methanol, both acidified
with 0.1% formic acid as given in Fig. 2.
Mass Spectrometry
For mass spectrometric analysis a Q Exactive quadrupole
Orbitrap mass spectrometer was used. The final setup
was run in electrospray mode, the spray voltage being +
4000 V (positive mode) or - 3000 V (negative mode). The
capillary temperature was at 320°C. S-lens-level was set
to 50, auxiliary gas flow rate was 15 (arbitrary units) and
sheath gas flow rate was 40 (arbitrary units) for both
ionization modes.
For data dependent experiments, full scan was recorded
with a resolution of 140,000 @
m/z
200, while the data
dependent MS
2
scans were recoded with a resolution of
17,500 @
m/z
200.
For AIF experiments, full scan was recorded with a
resolution of 140,000 @
m/z
200 and the fragment
spectra were recorded with a resolution of 17,500 @
m/z
200.
For DIA experiments, full scan was recorded with a
resolution of 70,000 @
m/z
200, automated gain control
was set to 500,000 and the maximal injection time was
200 ms. After the full scan different numbers of data
independent MSMS spectra were recorded. Isolation
widths and mass ranges were set according to Fig. 3.
Resolution was set to 17,500 @
m/z
200, AGC to 200,000
and maximal injection time to 100 ms.
resulting isolation wind
on the fragment ion sig
the smaller masses whi
shows only low amount
windows were kept sm
only one bigger window
Fig. 4).
FIGURE 1. Schematics of the Q Exactive mass
spectrometer.
FIGURE 4. Isolation wi
isolation windows in
the isolation window
from Ref.
1
).
So in total there were e
AIF experiment (row 1),
from
m/z
100 to 1000.
mass rage at
m/z
450 (
experiments subdivide
number of smaller isola
windows, of which seve
(row 8).
FIGURE 5. Influence
the sensitivity of sp
Morphine in a neat s
RT:
0.69 -2.10
1.0
1.5
2.0
Time (min)
0
20
40
60
80
100
0
20
40
60
80
100
0
20
40
60
80
100
0
20
40
60
80
100
Relative Abundance
0
20
40
60
80
100
0
20
40
60
80
100
1.34
1.32
1.34
1.31
1.36
1.30
1.37
1.29
1.40
1.27
1.44
1.49
1.25
1.56
1.66
1.23
1.34
1.33
1.35
1.29
1.42
1.27
1.50
1.26
1.54
1.35
1.29
1.40
1.51
1.33
1.31
1.34
1.35
1.30
1.37
1.28
1.44
1.52
1.32
1.36
1.30
1.37
1.27
1.40
1.26
1.43
1.26
1.54 1.61
NL: 1.20E8
m/z=
286.1409-286.1467
F: FTMS + pESI Full
ms [100.00-1000.00]
MS 130516pos_004
NL: 0
m/z=
268.1306-268.1360
F: FTMS + pESI Full
ms2 MS
130516pos_004
NL: 2.39E6
m/z=
201.0892-201.0932
F: FTMS + pESI Full
ms2 MS
130516pos_004
NL: 1.03E6
m/z=
229.0838-229.0884
F: FTMS + pESI Full
ms2 MS
130516pos_004
NL: 2.66E6
m/z=
211.0734-211.0776
F: FTMS + pESI Full
ms2 MS
130516pos_004
NL: 3.50E6
m/z=
183.0787-183.0823
F: FTMS + pESI Full
ms2 MS
130516pos_004
RT:
0.70 -2.10
1.0
1.5
Time (min)
0
20
40
60
80
100
0
20
40
60
80
100
0
20
40
60
80
100
0
20
40
60
80
100
Relative Abundance
0
20
40
60
80
100
0
20
40
60
80
100
1.32
1.31
1.34
1.29
1.35
1.27 1.37
1.39
1.26
1.41
1.25
1.4
1.23
1.
1.34
1.31
1.38
1.31
1
1.27
1.31
1.31
1.30
1.36
1.27 1.36
1.40
1.26
1.24
1.54
.23
1.32
1.33
1.29
1.34
1.35
1.36
1.29
1.38
1.27
1.41
1.26
1.24
1.32
1.33
1.29 1.36
1.36
1.27
1.24
1.47
1.31
1.36
1.28
1.27
1.39
1
1.24
1 window 2 wi
For chromatographic separation, a HPLC system was
used consisting of a CTC Pal autosampler (CTC analytics,
Zwingen, Switzerland) and a Rheos 2200 pump (Flux
Instruments, Switzerland). For separation a XBridge C18
column (50x2.1 mm, 3.5 µm particle size) was used,
applying a gradient of water and methanol, both acidified
with 0.1% formic acid as given in Fig. 2.
Mass Spectrometry
For mass spectrometric analysis a Q Exactive quadrupole
Orbitrap mass spectrometer was used. The final setup
was run in electrospray mode, the spray voltage being +
4000 V (positive ode) or - 3000 V (nega mode). Th
capill ry temperature was at 320°C. S-lens-level was set
to 50, auxiliary gas flow rate was 15 ( rbitrary units) and
sheath gas flow rate was 40 (arbitrary units) for both
ion z tion modes.
For d ta dependent experiments, full scan was recorded
with a resolution of 140,000 @
m/z
200, while the data
dependent MS
2
scans were recoded with a resolution of
17,500 @
m/z
200.
For AIF experiments, full scan was recorded with a
resolution of 140,000 @
m/z
200 and the fragment
spectra were recorded with a resolution of 17,500 @
m/z
200.
For DIA experiments, full scan w s recorded with a
resolution of 70,000 @
m/z
200, a mated gain control
was set to 500,000 and the maximal injection time was
200 ms. After the full scan different numbers of data
independent MSMS spectra were record . Isolation
widths and mass ranges were set ccording to Fig. 3.
Resolution was set to 17,500 @
m/z
200, AGC to 200,000
and maximal injection time to 100 ms.
on the fragment io sig
the smaller masses whi
shows only low amount
windows were kept m
only one bigger window
Fig. 4).
FIGURE 1. Schematics of the Q Exactive mass
spectrometer.
FIGURE 4. Isolation w
isolation windows in
the isolation window
fr m Ref.
1
).
So in total there were e
AIF experiment (row 1),
from
m/z
100 to 1000.
mass rage at
m/z
450 (
exp riments subdivide
nu ber of smaller isola
windows, of which sev
(row 8).
FIGURE 5. Influence
the sensitivity of sp
Morphine in a n at s
RT:
0.69 -2.10
1.0
1.5
2.0
Time (min)
0
20
40
60
80
100
0
20
40
60
80
100
0
20
40
60
80
100
0
20
40
60
80
100
Relative Abundance
0
20
40
60
80
100
0
20
40
60
80
100
1.34
1.32
1.34
1.31
1.36
1.30
1.37
1.29
1.40
1.27
1.44
1.49
1.25
1.56
1.66
1.23
1.34
1.33
1.35
1.29
1.42
1.27
1.50
1.26
1.54
1.35
1.29
1.40
1.51
1.33
1.31
1.34
1.35
1.30
1.37
1.28
1.44
1.52
1.32
1.36
1.30
1.37
1.27
1.40
1.26
1.43
1.26
1.54 1.61
NL: 1.20E8
m/z=
286.1409-286.1467
F: FTMS + pESI Full
ms [100.00-1000.00]
MS 130516pos_004
NL: 0
m/z=
268.1306-268.1360
F: FTMS + pESI Full
ms2 MS
130516pos_004
NL: 2.39E6
m/z=
201.0892-201. 932
F: FTMS + pESI Full
ms2 MS
130516pos_004
NL: 1.03E6
m/z=
229.0838-229.0884
F: FTMS + pESI Full
ms2 MS
130516pos_004
NL: 2.66E6
m/z=
211.0734-211.0776
F: FT + pESI Full
ms2 MS
130516pos_004
NL: 3.50E6
m/z=
183.0787-183.0823
F: FTMS + pESI Full
ms2 MS
130516pos_004
RT:
0.70 -2.10
1.0
1.5
Time (min)
0
20
40
60
80
100
0
20
40
60
80
100
0
20
40
60
80
100
0
20
40
60
80
100
Relative Abundance
0
20
40
60
80
100
0
20
40
60
80
100
1.32
1.31
1.34
1.29
1.35
1.27 1.37
1.39
1.26
1.41
1.25
1.4
1.23
1
1.34
1.31
1.38
1.31
1.27
1.31
1.31
1.30
1.36
1.27 1.36
1.40
1.26
1.24
1.5
1.23
1.32
1.33
1.29
1.34
1.35
1.36
1.29
1.38
1.27
1.41
1.26
1.24
1.32
. 3
1.29 1.36
1.36
1.27
1.24
1.47
1.31
1.36
1.28
1.27
1.39
1.24
1 window 2 wi