


 200 / 302

6
Enhancing General Unknown Screening with Data Independent Analysis on a Quadrupole Orbitrap Mass Spectrometry System
F mode as described. After
omatograms were generated
d specific ions for a number
the XICs for Morphine and
of the fragments are missing
n irregular peak shape than
r ion, because the signal
lthough the concentration of
g/L.
were evaluated. The
re windows with smaller
hould yield better sensitivity
ince the ion flux is bigger on
mass range above
m/z
500
trix ions, the isolation
As shown in Fig. 5, with increasing number of windows,
leading to smaller window sizes, the fragment signals grow
in intensity and their peak shape becomes similar to the
shape of the signal from the quasimolecular ion, giving full
evidence that the fragments are connected to the
respective quasimolecular ion. Since there is no significant
difference in signal quality between a 5 window experiment
and a 7 window experiment, the favor for routine use could
be on the 5 window experiment due to the total cycle time
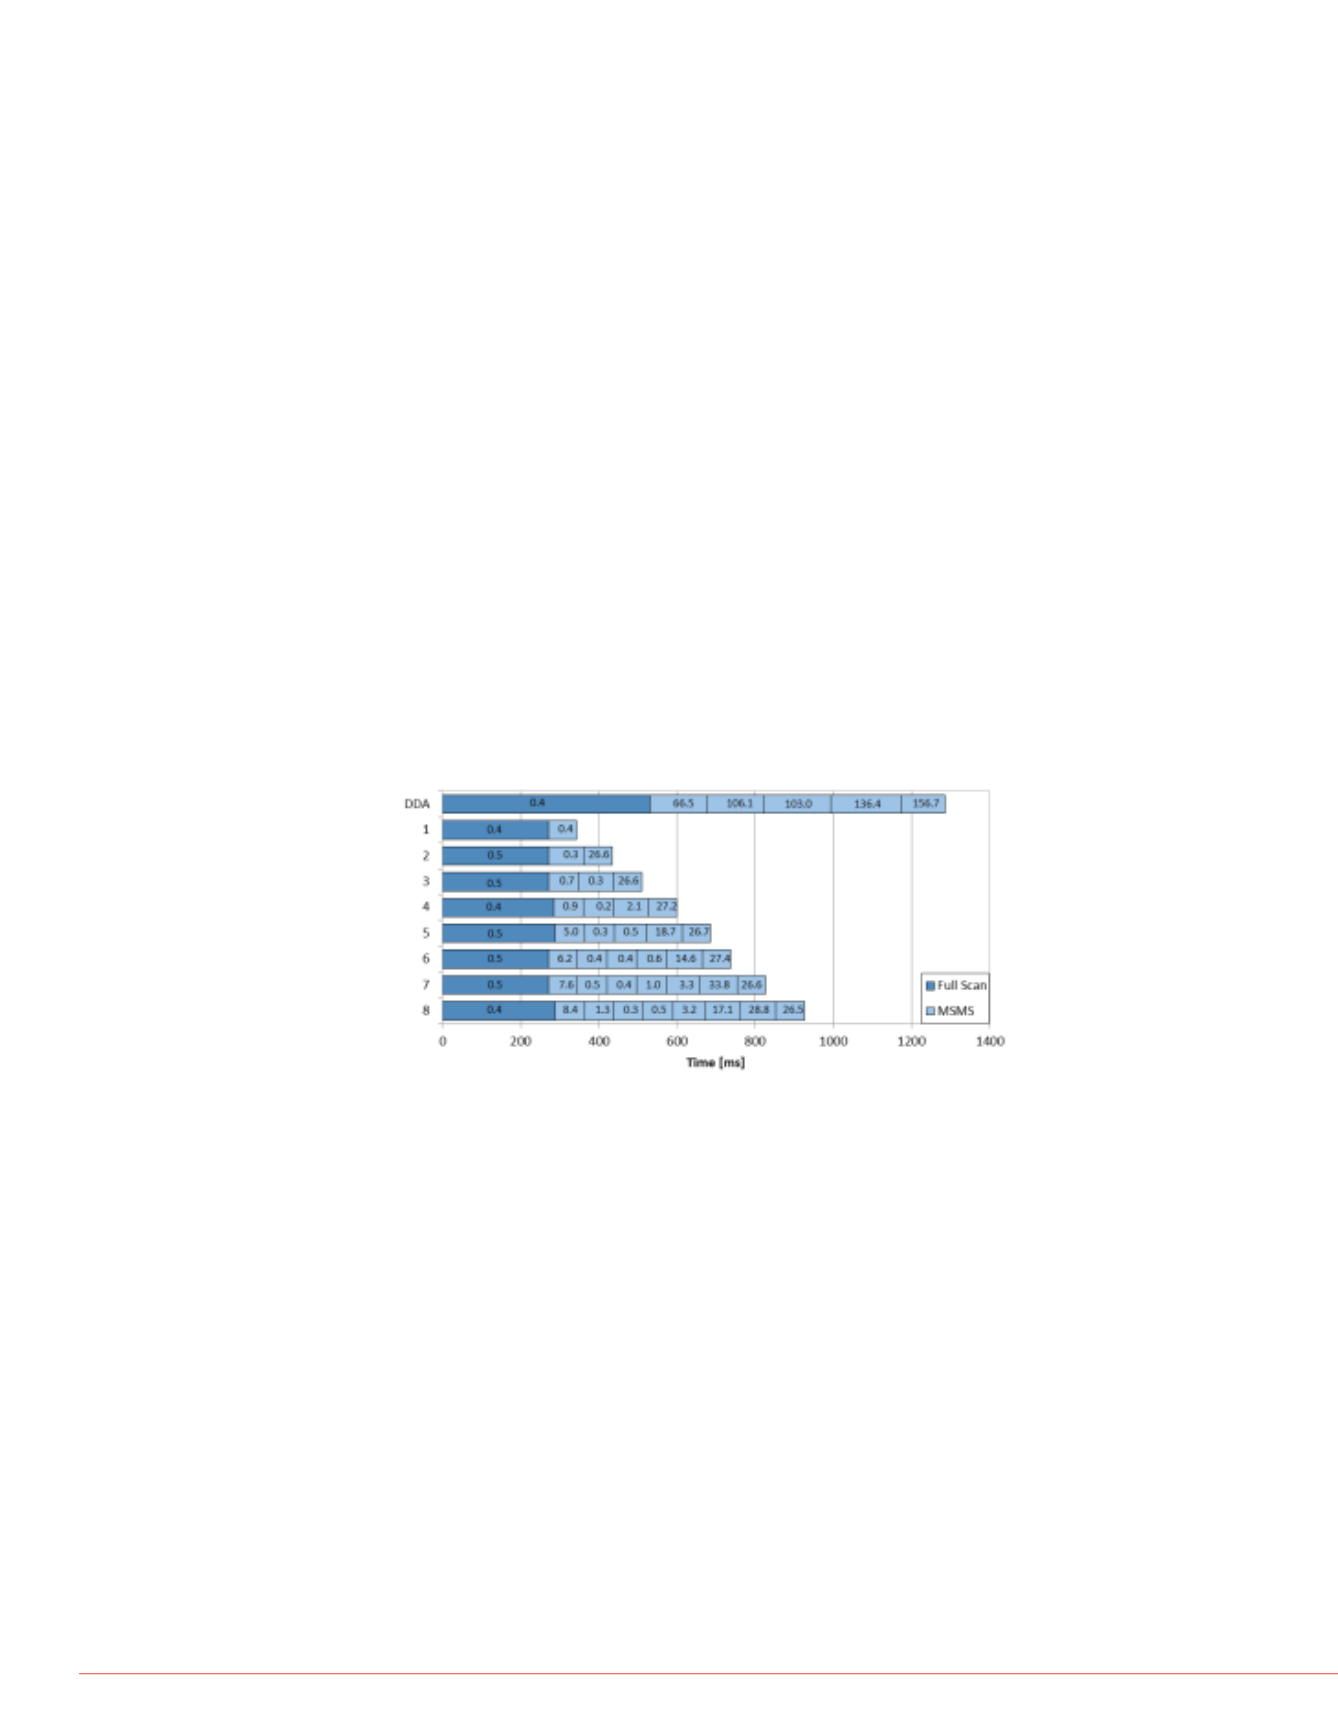
and the resulting data rate. As shown in Fig. 6, the different
experiment times yield significantly different cycle times. It
was no surprise, that the AIF experiment shows the
shortest cycle time with little more than 250 ms, while the 8
window DIA experiment has roughly 850 ms. As expected,
the 5 window experiment came up as a good compromise
with about 650 ms. For comparison the so far used data
dependent Top 5 MS
2
experiment is shown as well, which
had a cycle time of more than 1 s, due to the small ion flux
in the small isolation windows of 1 Da, which resulted in
very long ion times.
s for the chromatographic
RT:
0.79 -2.70
1.0
1.5
2.0
2.5
Time (min)
0
20
40
60
80
100
0
20
40
60
80
100
0
20
40
60
80
100
RelativeAbundance
0
20
40
60
80
100
0
20
40
60
80
100
1.89
1.85
1.89
1.83
1.92
1.82
1.95
1.81
1.96
1.80
1.98
1.78
2.02
1.77
2.08
2.14
1.76
2.39 2.51
1.26
1.83
1.85
1.83
1.81
1.87
1.81
1.91
1.79
1.92
1.78
1.95
2.03
2.44
1.85
1.82
1.86
1.80
1.87
1.91
1.79
1.94
1.78
1.77
1.95
2.07
2.50
2.49
1.86
1.86
1.89
1.91
1.83
1.93
1.82
1.94
1.81
1.96
1.79
1.99
1.79
2.02
1.77
2.07
2.14
1.75
2.28 2.55
1.52
0.86
1.85
1.84
1.83 1.90
1.82
1.93
1.79
1.95
1.77
2.06
NL:1.51E8
m/z=
273.1250-273.1304
F: FTMS +pESI Full
ms [100.00-1000.00]
MS130516pos_004
NL:2.57E6
m/z=
255.1135-255.1187
F: FTMS +pESI Full
ms2 MS
130516pos_004
NL:3.84E6
m/z=
213.0672-213.0714
F: FTMS +pESI Full
ms2 MS
130516pos_004
NL:5.27E7
m/z=
133.0747-133.0773
F: FTMS +pESI Full
ms2 MS
130516pos_004
NL:1.21E6
m/z=
176.1289-176.1325
F: FTMS +pESI Full
ms2 MS
130516pos_004
row) and fragment ions for
) in AIF mode
B
Another question was if not only the sensitivity, but also the
selectivity could be increased using the DIA approach. The
insect repellant DEET showed an interference in the
fragment
m/z
119.0493. With on window (i. e. AIF) a clear
shoulder was visible which was not present in the signal of
the parent ion. This interference signal did not change at
first with increasing the number of windows for DIA, but
with eight windows (isolation width of 50 Da) suddenly the
chromatographic peak showed the same shape as the
parent peak from the full scan. This indicates, that it is
possible to even increase the selectivity with the larger
number of isolation windows in DIA. This is shown clearly
in Fig. 7.
FIGURE 6. Cycle times for different experiment types;
DDA: data dependent Top 5 MS
2
; 1 – 8: DIA experiments
with according number of windows as shown in Fig. 4;
numbers in the boxes stand for average ion times.