


 201 / 302

7
Thermo Scientific Poster Note
•
PN64245-RAFA 0914S
Conclusion
It could be shown, that with DIA the sensitivity and
selectivity of fragment ions can be increased significantly.
Since this is a technique without targeted precursor ion
selection, no signals are filtered out. This enables all
possibilities for post acquisition processing in a targeted
and untargeted approach the same way, so prerequisites
for General Unknown Screening are given without
compromise.
References
1. B. Vogler, Master Thesis, University of Zurich,
Switzerland, 2013
aluated. The
ws with smaller
eld better sensitivity
ion flux is bigger on
nge above
m/z
500
, the isolation
below
m/z
500 with
above
m/z
500 (see
fferent numbers of
top row shows
n (figure taken
1.5
2.0
2.5
Time(min)
1.89
1.91
1.83
1.93
1.82
1.94
1.81
1.96
1.79
1.99
1.79
2.02
1.77
2.07
2.14
1.75
2.28 2.55
1.52
1.85
1.84
1.83 1.90
1.82
1.93
1.79
1.95
1.77
2.06
m/z=
133.0747-133.0773
F: FTMS +pESI Full
ms2 MS
130516pos_004
NL:1.21E6
m/z=
176.1289-176.1325
F: FTMS +pESI Full
ms2 MS
130516pos_004
d fragment ions for
mode
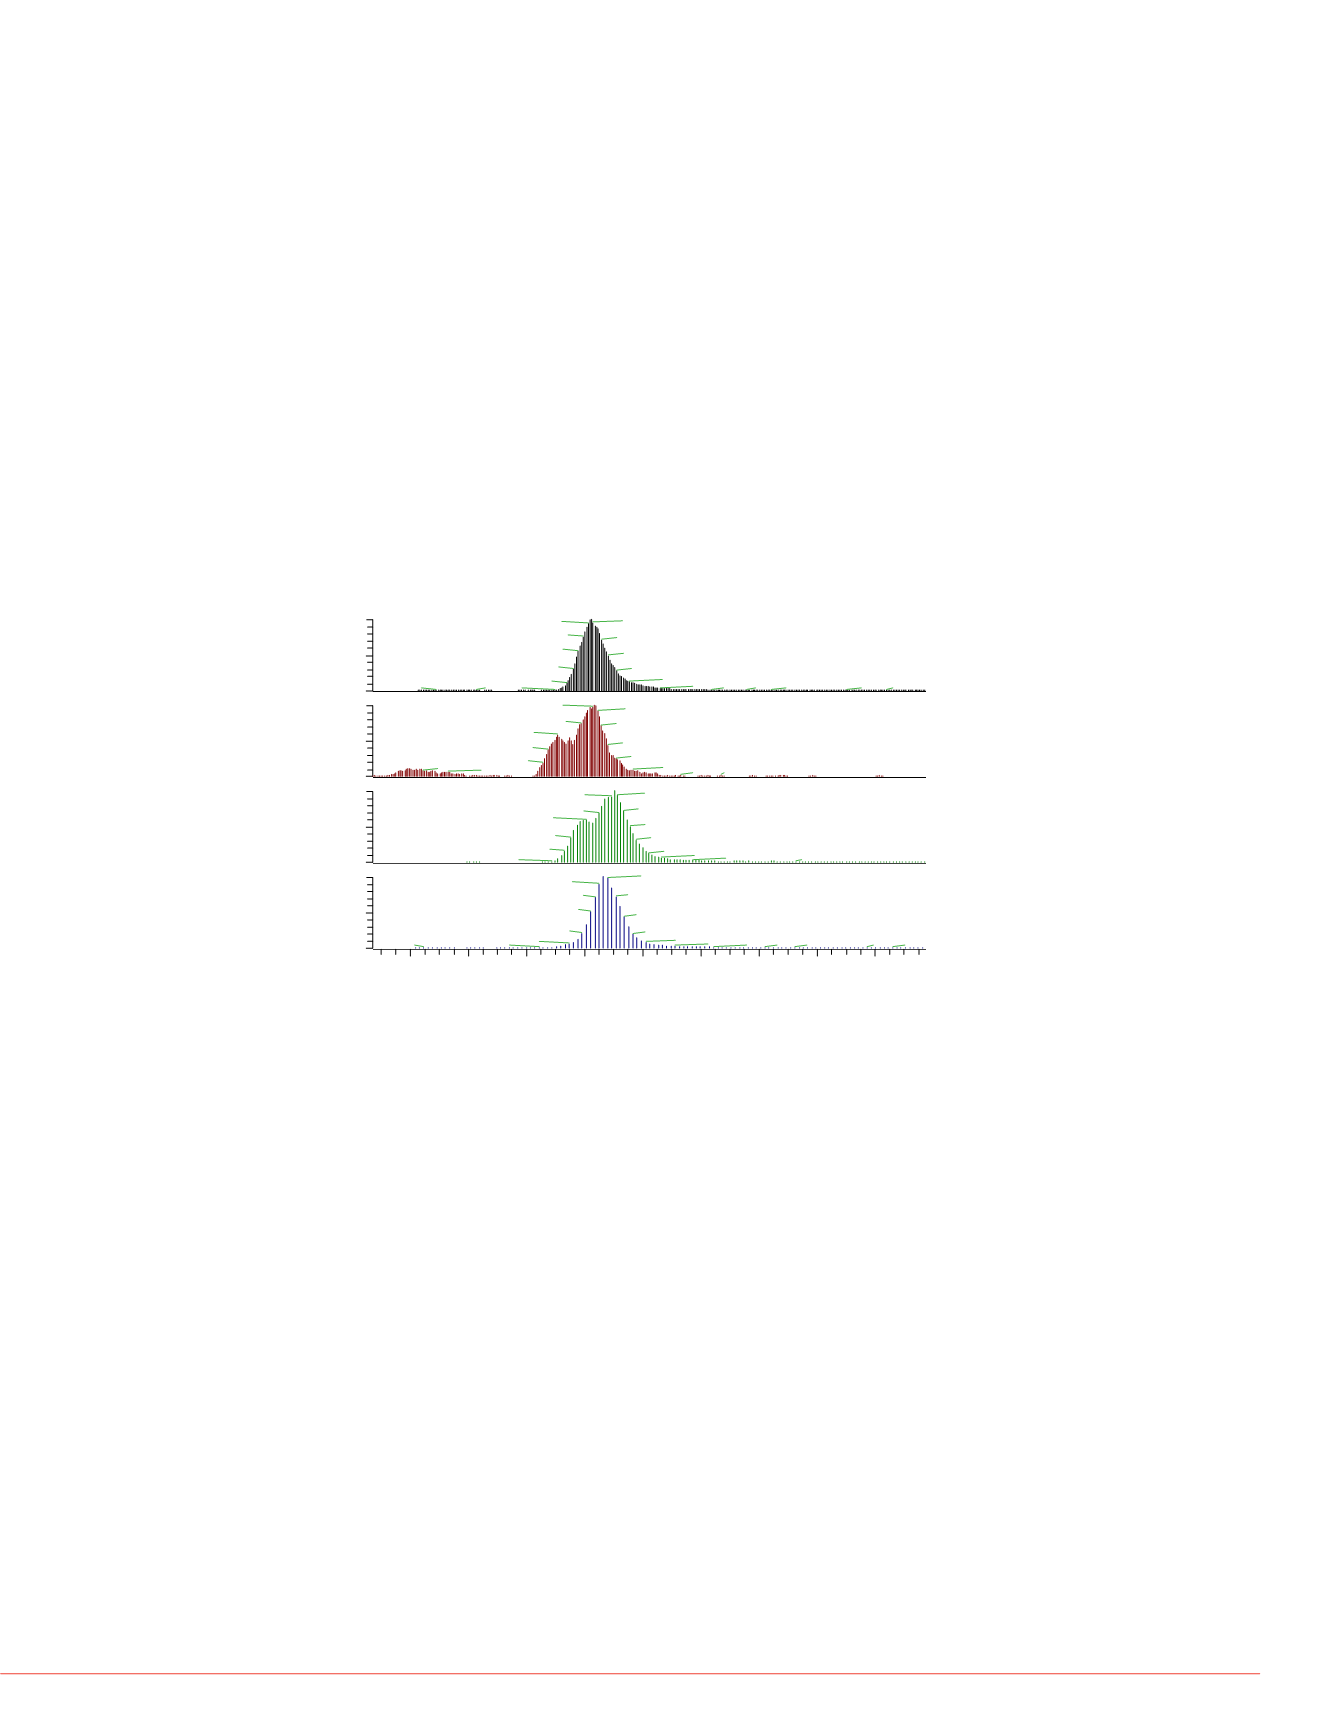
Another question was if not only the sensitivity, but also
the selectivity could be increased using the DIA approach.
The insect repellant DEET showed an interference in the
fragment
m/z
119.0493. With on
e
window (i.e. AIF) a clear
shoulder was visible which was not present in the signal of
the parent ion. This interference signal did not change at
first with increasing the number of windows for DIA, but
with eight windows (isolation width of 50 Da) suddenly the
chromatographic peak showed the same shape as the
parent peak from the full scan. This indicates, that it is
possible to even increase the selectivity with the larger
number of isolation windows in DIA. This is shown clearly
in Fig. 7.
nts, starting with the
whole mass range
riment divided the
following
to an increasing
nding up with eight
tion width of 50 Da
33
1.34
1.35
1.36
1.39
1.41
1.44
1.52
1.60
2
1.33
1.36
1.38
1.40
1.44
1.45
1.52
2.10
2
1.33
1.34
1.36
1.37
1.40
1.47
1.56
1.77
2
1.34
1.35
1.36
NL:1.19E8
m/z=
286.1409-286.1467
F: FTMS +pESI Full
ms[100.00-1000.00]
MS130516pos_008
NL:8.52E5
m/z=
268.1306-268.1360
F: FTMS +pESI Full
ms2 MS
130516pos_008
NL:4.61E6
m/z=
201.0892-201.0932
F: FTMS +pESI Full
ms2 MS
130516pos_008
NL:3.09E6
m/z=
229.0838-229.0884
F: FTMS +pESI Full
ms2 MS
RT:
0.69-2.12
60
80
100
0
20
40
60
80
100
RelativeAbundance
0
20
40
60
80
100
0
20
40
60
80
100
1.31 1.33
1.30
1.34
1.29
1.27
1.36
1.26
1.39
1.25
1.41
1.47
1.23
1.54
1.76
1.21
1.32
1.31
1.34
1.30
1.35
1.27
1.37
1.38
1.25
1.41
1.48
1.23
1.80
1.32
1.31
1.34
1.30
1.27 1.35
1.37
1.25
1.39
1.24
1.44
1.23
1.51
1.58
1.20
1.79
0.89
1.30 1.32
1.28
1.27 1.35
NL:1.21E8
m/z=
286.1409-286.1467
F: FTMS +pESI Full
ms[100.00-1000.00]
MS130516pos_010
NL:9.15E5
m/z=
268.1306-268.1360
F: FTMS +pESI Full
ms2 MS
130516pos_010
NL:3.73E6
m/z=
201.0892-201.0932
F: FTMS +pESI Full
ms2 MS
130516pos_010
NL:2.64E6
m/z=
229.0838-229.0884
F: FTMS +pESI Full
ms2 MS
indows 7 windows
FIGURE 7. Interferences filtered out by DIA with higher
number of isolation windows on the Example of DEET.
RT:
7.87 - 9.79
SM:
5G
8.0
8.2
8.4
8.6
8.8
9.0
9.2
9.4
9.6
Time (min)
0
50
100
0
50
100
0
50
100
Relative Abundance
0
50
100
8.62 8.63
8.61
8.60 8.66
8.58
8.68
8.56
8.71
8.76
8.54
8.86 9.04 9.16 9.24
8.50
9.45 9.50 9.64
8.15
8.09
8.23
8.63
8.63
8.65
8.59 8.66
8.51
8.68
8.47
8.71
8.46
7.99
8.77
8.04 8.13
9.28
8.93 9.07
9.38
9.61
8.70 8.71
8.69
8.73
8.65
8.61
8.76
8.55
8.78
8.53
8.82 8.86 8.97 9.24 9.33
8.49
9.50
9.71
8.22
8.66 8.68
8.65
8.71
8.64
8.62
8.74
8.59
8.77
8.81
8.55
8.91 9.04 9.22 9.32 9.49 9.57 9.66
8.44
8.22
8.12
8.05
parent ion
1 window
5 windows
8 windows