


 199 / 302

5
Thermo Scientific Poster Note
•
PN64245-RAFA 0914S
Conclusion
It could be shown, that
selectivity of fragment io
Since this is a technique
selection, no signals are
possibilities for post acq
and untargeted approac
for General Unknown S
compromise.
References
1. B. Vogler, Master T
Switzerland, 2013
nd waste water samples
s described earlier
1
.
n, a HPLC system was
autosampler (CTC analytics,
heos 2200 pump (Flux
separation a XBridge C18
article size) was used,
nd methanol, both acidified
in Fig. 2.
is a Q Exactive quadrupole
as used. The final setup
the spray voltage being +
00 V (negative mode). The
20°C. S-lens-level was set
as 15 (arbitrary units) and
rbitrary units) for both
nts, full scan was recorded
m/z
200, while the data
coded with a resolution of
was recorded with a
00 and the fragment
resolution of 17,500 @
m/z
was recorded with a
0, automated gain control
aximal injection time was
erent numbers of data
DIA Mode
In DIA mode different setups were evaluated. The
assumption was that with more windows with smaller
resulting isolation windows should yield better sensitivity
on the fragment ion signals. Since the ion flux is bigger on
the smaller masses while the mass range above
m/z
500
shows only low amount of matrix ions, the isolation
windows were kept small in the range below
m/z
500 with
only one bigger window for the range above
m/z
500 (see
Fig. 4).
All trademarks used are the property of Thermo
This information is not intended to encourage us
property rights of others.
Presented at RAFA, Prague, Czech Republic, N
e Q Exactive mass
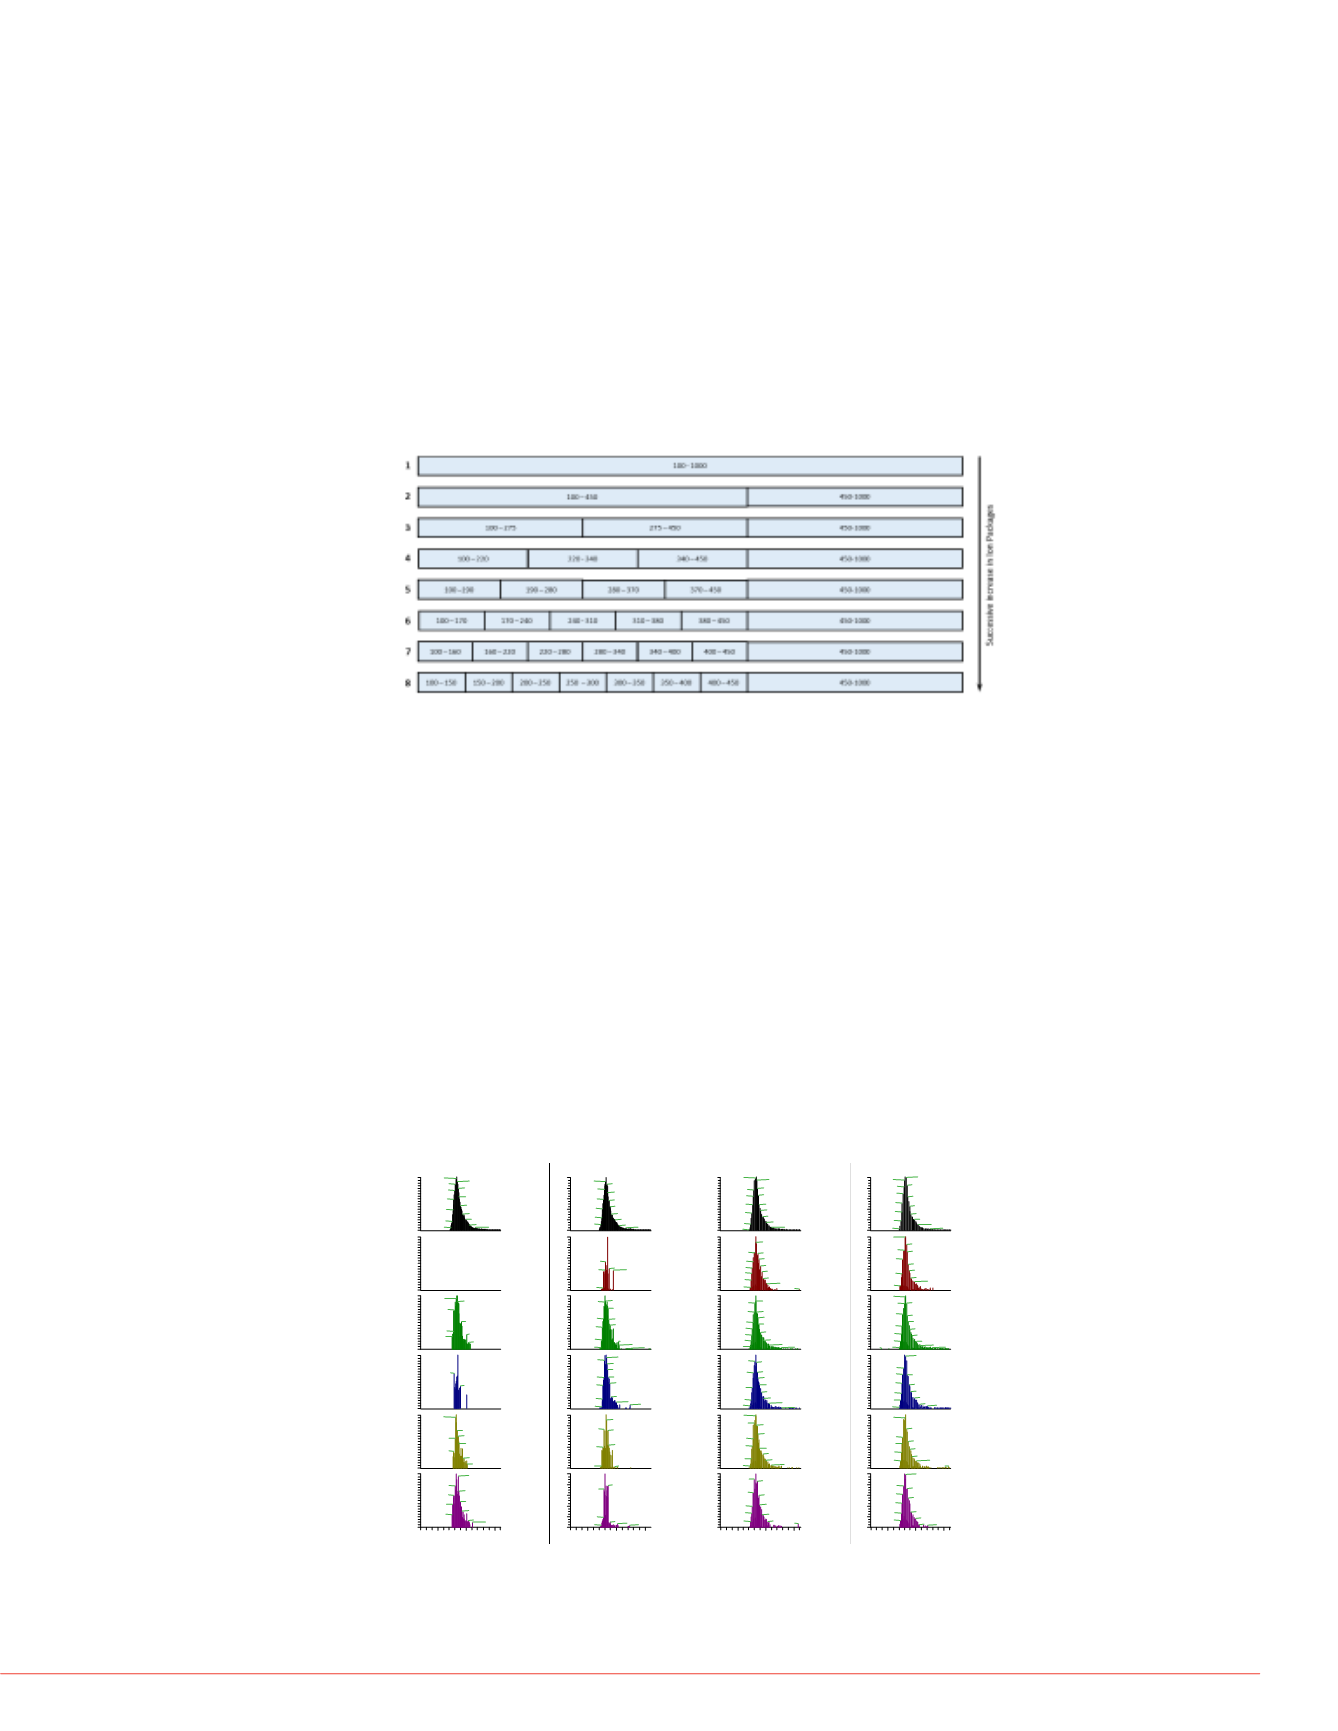
FIGURE 4. Isolation windows for different numbers of
isolation windows in DIA mode; the top row shows
the isolation window of the full scan (figure taken
from Ref.
1
).
the parent ion. This inte
first with increasing the
with eight windows (isol
chromatographic peak s
parent peak from the ful
possible to even increas
number of isolation win
in Fig. 7.
So in total there were eight experiments, starting with the
AIF experiment (row 1), covering the whole mass range
from
m/z
100 to 1000. The next experiment divided the
mass rage at
m/z
450 (row 2) and the following
experiments subdivided this range into an increasing
number of smaller isolation ranges, ending up with eight
windows, of which seven had an isolation width of 50 Da
(row 8).
FIGURE 5. Influence of the number of DIA windows on
RT:
0.69 -2.10
1.0
1.5
2.0
Time (min)
0
20
40
60
80
100
0
20
40
60
80
100
0
20
40
60
80
100
0
20
40
60
80
100
Relative Abundance
0
20
40
60
80
100
0
20
40
60
80
100
1.34
1.32
1.34
1.31
1.36
1.30
1.37
1.29
1.40
1.27
1.44
1.49
1.25
1.56
1.66
1.23
1.34
1.33
1.35
1.29
1.42
1.27
1.50
1.26
1.54
1.35
1.29
1.40
1.51
1.33
1.31
1.34
1.35
1.30
1.37
1.28
1.44
1.52
1.32
1.36
1.30
1.37
1.27
1.40
1.26
1.43
1.26
1.54 1.61
NL: 1.20E8
m/z=
286.1409-286.1467
F: FTMS + pESI Full
ms [100.00-1000.00]
MS 130516pos_004
NL: 0
m/z=
268.1306-268.1360
F: FTMS + pESI Full
ms2 MS
130516pos_004
NL: 2.39E6
m/z=
201.0892-201.0932
F: FTMS + pESI Full
ms2 MS
130516pos_004
NL: 1.03E6
m/z=
229.0838-229.0884
F: FTMS + pESI Full
ms2 MS
130516pos_004
NL: 2.66E6
m/z=
211.0734-211.0776
F: FTMS + pESI Full
ms2 MS
130516pos_004
NL: 3.50E6
m/z=
183.0787-183.0823
F: FTMS + pESI Full
ms2 MS
130516pos_004
RT:
0.70 -2.10
1.0
1.5
2.0
Time (min)
0
20
40
60
80
100
0
20
40
60
80
100
0
20
40
60
80
100
0
20
40
60
80
100
Relative Abundance
0
20
40
60
80
100
0
20
40
60
80
100
1.32
1.31
1.34
1.29
1.35
1.27 1.37
1.39
1.26
1.41
1.25
1.47
1.23
1.55
1.67
1.34
1.31
1.38
1.31
1.45
1.27
1.31
1.31
1.30
1.36
1.27 1.36
1.40
1.26
1.24
1.54
1.55
1.23
1.76
1.32
1.33
1.29
1.34
1.35
1.36
1.29
1.38
1.27
1.41
1.26
1.50
1.74
1.24
1.32
1.33
1.29 1.36
1.36
1.27
1.24
1.47 1.75
1.31
1.36
1.28
1.27
1.39
1.53
1.24
1.73
NL: 1.27E8
m/z=
286.1409-286.1467
F: FTMS +p ESI Full
ms[100.00-1000.00]
MS 130516pos_005
NL: 1.89E6
m/z=
268.1306-268.1360
F: FTMS +p ESI Full
ms2 MS
130516pos_005
NL: 5.27E6
m/z=
201.0892-201.0932
F: FTMS +p ESI Full
ms2 MS
130516pos_005
NL: 5.28E6
m/z=
229.0838-229.0884
F: FTMS +p ESI Full
ms2 MS
130516pos_005
NL: 2.53E6
m/z=
211.0734-211.0776
F: FTMS +p ESI Full
ms2 MS
130516pos_005
NL: 9.76E5
m/z=
183.0787-183.0823
F: FTMS +p ESI Full
ms2 MS
130516pos_005
RT:
0.69 -2.12
1.0
1.5
2.0
Time (min)
0
20
40
60
80
100
0
20
40
60
80
100
0
20
40
60
80
100
0
20
40
60
80
100
Relative Abundance
0
20
40
60
80
100
0
20
40
60
80
100
1.33
1.32
1.34
1.35
1.29
1.36
1.28
1.26 1.39
1.41
1.25
1.44
1.52
1.23
1.60
1.20
1.32
1.33
1.31 1.36
1.38
1.27
1.40
1.26
1.44
1.25
1.45
1.24
1.52
1.23
2.10
1.32
1.33
1.31
1.29 1.34
1.36
1.27 1.37
1.26
1.40
1.25
1.47
1.24
1.56
1.22
1.77
1.32
1.31 1.34
1.35
1.28
1.36
1.39
1.26
1.42
1.47
1.24
1.56
1.22
1.78
1.33
1.32
1.29
1.34
1.36
1.27
1.26
1.39
1.45
1.24
1.50
1.60
1.22
1.32
1.29
1.35
1.27
1.38
1.39
1.26
1.25
1.44
1.23
1.54
2.08
NL: 1.19E8
m/z=
286.1409-286.1467
F: FTMS +p ESI Full
ms [100.00-1000.00]
MS 130516pos_008
NL: 8.52E5
m/z=
268.1306-268.1360
F: FTMS +p ESI Full
ms2 MS
130516pos_008
NL: 4.61E6
m/z=
201.0892-201.0932
F: FTMS +p ESI Full
ms2 MS
130516pos_008
NL: 3.09E6
m/z=
229.0838-229.0884
F: FTMS +p ESI Full
ms2 MS
130516pos_008
NL: 1.88E6
m/z=
211.0734-211.0776
F: FTMS +p ESI Full
ms2 MS
130516pos_008
NL: 1.30E6
m/z=
183.0787-183.0823
F: FTMS +p ESI Full
ms2 MS
130516pos_008
RT:
0.69 -2.12
1.0
1.5
2.0
Time (min)
0
20
40
60
80
100
0
20
40
60
80
100
0
20
40
60
80
100
0
20
40
60
80
100
Relative Abundance
0
20
40
60
80
100
0
20
40
60
80
100
1.31 1.33
1.30
1.34
1.29
1.27
1.36
1.26
1.39
1.25
1.41
1.47
1.23
1.54
1.76
1.21
1.32
1.31
1.34
1.30
1.35
1.27
1.37
1.38
1.25
1.41
1.48
1.23
1.80
1.32
1.31
1.34
1.30
1.27 1.35
1.37
1.25
1.39
1.24
1.44
1.23
1.51
1.58
1.20
1.79
0.89
1.30 1.32
1.28
1.27 1.35
1.25 1.38
1.41
1.24
1.48
1.23
1.57 1.71
1.20
1.32
1.31
1.34
1.27
1.37
1.25
1.39
1.24
1.44
1.51
1.23
2.08
1.30 1.32
1.28
1.35
1.27
1.37
1.25
1.41
1.24
1.50
1.23
1.55 1.71
NL: 1.21E8
m/z=
286.1409-286.1467
F: FTMS + pESI Full
ms [100.00-1000.00]
MS 130516pos_010
NL: 9.15E5
m/z=
268.1306-268.1360
F: FTMS + pESI Full
ms2 MS
130516pos_010
NL: 3.73E6
m/z=
201.0892-201.0932
F: FTMS + pESI Full
ms2 MS
130516pos_010
NL: 2.64E6
m/z=
229.0838-229.0884
F: FTMS + pESI Full
ms2 MS
130516pos_010
NL: 1.71E6
m/z=
211.0734-211.0776
F: FTMS + pESI Full
ms2 MS
130516pos_010
NL: 1.12E6
m/z=
183.0787-183.0823
F: FTMS + pESI Full
ms2 MS
130516pos_010
1 window 2 windows 5 windows 7 windows
FIGURE 7. Interferenc
number of isolation wi
RT:
7.87 - 9.79
SM:
5G
8.0
8.2
8.4
0
50
100
0
50
100
0
50
100
Relative Abundance
0
50
100
8.6
8.
8.5
8.5
8.54
8.50
8.15
8.09
8.23
8.6
8.
8.51
8.47
8.46
7.99 8.04 8.13
8.61
8.55
8.53
8.49
8.22
8
8
8.55
8.44
8.22
8.12
8.05
Conclusion
It could be shown, that
selectivity of fragment io
Since this is a technique
selection, no signals are
possibilities for post acq
and untargeted approac
for Gene al Unknown S
compromise.
References
1. B. Vogler, Master T
Switzerland, 2013
nd waste water samples
s described earlier
1
.
n, a HPLC system was
autosampler (CTC an lytics,
heos 2200 pump (Flux
separation a XBridge C18
article size) was used,
nd m thanol, both acidified
in Fig. 2.
is a Q Exactive quadrupole
a used. The final setup
the pray voltage b ing +
00 V (negative mod ). The
2 °C. S-lens-l vel was set
as 15 (arbitrary units) and
rbitrary units) for both
nts, full scan was recorded
m/z
200, while th data
coded with a resolution of
was recorded with a
00 and the fragment
resolution of 17,500 @
m/z
was recorded with a
0, automated gain control
aximal injection time was
erent numbers of data
ere recorded. Isolation
DIA Mode
In DIA mode different setups were evaluated. The
assumption was that with more windows with smaller
resulting isolation windows should yield be ter sensitivity
on the fragment ion signal . Since the ion flux i bigger on
the smaller masses while the mass range above
m/z
500
s ows only low amount of matrix ions, th is lation
windows were kept small in the range below
m/z
500 with
only ne bigg r window for t r
above
m/z
(see
Fig. 4).
All trademarks used are the property of Thermo
This information is not intended to encourage us
property right of othe s.
Pre ented t RAFA, Prague, Czech Republic, N
e Q Exactive mass
FIGURE 4. Isolation windows for different numbers of
isolation windows in DIA mode; the top row shows
the isolation window of the full scan (figure taken
from Ref.
1
).
first with increasing the
with eight windows (isol
chromatographic peak s
pa ent peak from the ful
ossible to even increas
number of isolatio win
in Fig. 7.
So in total there were eight experiments, starting with the
AIF experim nt (row 1), cov ring th whole mass range
from
m/z
100 to 1000. The next experiment divided the
mass rage at
m/z
45 (row 2) and the following
experiments subdivided this range into an increasing
number of maller isolation ranges, endi g up with eight
windows, of which even had an i olatio width of 50 Da
(row 8).
FIGURE 5. Influence of the number of DIA windows on
the sensitivity of specific fragments on the example of
RT:
0.69 -2.10
1.0
1.5
2.0
Time (min)
0
20
40
60
80
100
0
20
40
60
80
100
0
20
40
60
80
100
0
20
40
60
80
100
Relative Abundance
0
20
40
60
80
100
0
20
40
60
80
100
1.34
1.32
1.34
1.31
1.36
1.30
1.37
1.29
1.40
1.27
1.44
1.49
1.25
1.56
1.66
1.23
1.34
1.33
1.35
1.29
1.42
1.27
1.50
1.26
1.54
1.35
1.29
1.40
1.51
1.33
1.31
1.34
1.35
1.30
1.37
1.28
1.44
1.52
1.32
1.36
1.30
1.37
1.27
1.40
1.26
.43
1.26
1.54 1.61
NL: 1.20E8
m/z=
286.1409-286.1467
F: FTMS + pESI Full
ms [100.00-1000.00]
MS 130516pos_004
NL: 0
m/z=
268.1306-268.1360
F: FTMS + pESI Full
ms2 MS
130516pos_004
NL: 2.39E6
m/z=
201.0892-201.0932
F: FTMS + pESI Full
ms2 MS
130516pos_004
NL: 1.03E6
m/z=
229.0838-229.0884
F: FTMS + pESI Full
ms2 MS
130516pos_004
NL: 2.66E6
m/z=
211.0734-211.0776
F: FTMS + pESI Full
ms2 MS
130516pos_004
NL: 3.50E6
m/z=
183.0787-183.0823
F: FTMS + pESI Full
ms2 MS
130516pos_004
RT:
0.70 -2.10
1.0
1.5
2.0
Time (min)
0
20
40
60
80
100
0
20
40
60
80
100
0
20
40
60
80
100
0
20
40
60
80
100
Relative Abundance
0
20
40
60
80
100
0
20
40
60
80
100
1.32
1.31
1.34
1.29
1.35
1.27 1.37
1.39
1.26
1.41
1.25
1.47
1.23
1.55
1.67
1.34
1.31
1.38
1.31
1.45
1.27
1.31
1.31
1.30
1.36
1.27 1.36
1.40
1.26
1.24
1.54
1.55
1.23
1.76
1.32
1.33
1.29
1.34
1.35
1.36
1.29
1.38
1.27
1.41
1.26
1.50
1.74
1.24
1.32
1.33
1.29 1.36
1.36
1.27
1.24
1.47 1.75
1.31
1.36
1.28
1.27
1.39
1.53
1.24
1.73
NL: 1.27E8
m/z=
286.1409-286.1467
F: FTMS +p ESI Full
ms[100.00-1000.00]
MS 130516pos_005
NL: .89E6
m/z=
268.1306-268.1360
F: FTMS +p ESI Full
ms2 MS
130516pos_005
NL: 5.27E6
m/z=
201.0892-201.0932
F: FTMS +p ESI Full
ms2 MS
130516pos_005
NL: 5.28E6
m/z=
229.0838-229.0884
F: FTMS +p ESI Full
ms2 MS
130516pos_005
NL: 2.53E6
m/z=
211.0734-211.0776
F: FTMS +p ESI Full
ms2 MS
130516pos_005
NL: 9.76E5
m/z=
183.0787-183.0823
F: FTMS +p ESI Full
ms2 MS
130516pos_005
RT:
0.69 -2.12
1.0
1.5
2.0
Time (min)
0
20
40
60
80
100
0
20
40
60
80
100
0
20
40
60
80
100
0
20
40
60
80
100
Relative Abundance
0
20
40
60
80
100
0
20
40
60
80
100
1.33
1.32
1.34
1.35
1.29
1.36
1.28
1.26 1.39
1.41
1.25
1.44
1.52
1.23
1.60
1.20
1.32
1.33
1.31 1.36
1.38
1.27
1.40
1.26
1.44
1.25
1.45
1.24
1.52
1.23
2.10
1.32
1.33
1.31
1.29 1.34
1.36
1.27 1.37
1.26
1.40
1.25
1.47
1.24
1.56
1.22
1.77
1.32
1.31 1.34
1.35
1.28
1.36
1.39
1.26
1.42
1.47
1.24
1.56
1.22
1.78
1.33
1.32
1.29
1.34
1.36
1.27
1.26
1.39
1.45
1.24
1.50
1.60
1.22
1.32
1.29
1.35
1.27
1.38
1.39
1.26
1.25
1.44
1.23
1.54
2.08
NL: 1.19E8
m/z=
286.1409-286.1467
F: FTMS +p ESI Full
ms [100.00-1000.00]
MS 130516pos_008
NL: 8.52E5
m/z=
268.1306-268.1360
F: FTMS +p ESI Full
ms2 MS
130516pos_008
NL: 4.61E6
m/z=
201.0892-201.0932
F: FTMS +p ESI Full
ms2 MS
130516pos_008
NL: 3.09E6
m/z=
229.0838-229.0884
F: FTMS +p ESI Full
ms2 MS
130516pos_008
NL: 1.88E6
m/z=
211.0734-211.0776
F: FTMS +p ESI Full
ms2 MS
130516pos_008
NL: 1.30E6
m/z=
183.0787-183.0823
F: FTMS +p ESI Full
ms2 MS
130516pos_008
RT:
0.69 -2.12
1.0
1.5
2.0
Time (min)
0
20
40
60
80
100
0
20
40
60
80
100
0
20
40
60
80
100
0
20
40
60
80
100
Relative Abundance
0
20
40
60
80
100
0
20
40
60
80
100
1.31 1.33
1.30
1.34
1.29
1.27
1.36
1.26
1.39
1.25
1.41
1.47
1.23
1.54
1.76
1.21
1.32
1.31
1.34
1.30
1.35
1.27
1.37
1.38
1.25
1.41
1.48
1.23
1.80
1.32
1.31
1.34
1.30
1.27 1.35
1.37
1.25
1.39
1.24
1.44
1.23
1.51
1.58
1.20
1.79
0.89
1.30 1.32
1.28
1.27 1.35
1.25 1.38
41
1.24
1.48
1.23
1.57 1.71
1.20
1.32
1.31
1.34
1.27
1.37
1.25
1.39
1.24
1.44
1.51
1.23
2.08
1.30 1.32
1.28
1.35
1.27
1.37
1.25
1.41
1.24
1.50
1.23
1.55 1.71
NL: 1.21E8
m/z=
286.1409-286.1467
F: FTMS + pESI Full
ms [100.00-1000.00]
MS 130516pos_010
NL: 9.15E5
m/z=
268.1306-268.1360
F: FTMS + pESI Full
ms2 MS
130516pos_010
NL: 3.73E6
m/z=
201.0892-201.0932
F: FTMS + pESI Full
ms2 MS
130516pos_010
NL: 2.64E6
m/z=
229.0838-229.0884
F: FTMS + pESI Full
ms2 MS
130516pos_010
NL: 1.71E6
m/z=
211.0734-211.0776
F: FTMS + pESI Full
ms2 MS
130516pos_010
NL: 1.12E6
m/z=
183.0787-183.0823
F: FTMS + pESI Full
ms2 MS
130516pos_010
1 window 2 windows 5 windows 7 windows
FIGURE 7. Interferenc
number of isolation wi
RT:
7.87 - 9.79
SM:
5G
8.0
8.2
8.4
5
100
5
100
5
100
Relative Abundance
5
100
8.6
8.
8.5
8.5
8.54
8.50
8.15
8.09
8.23
8.6
8.
8.51
8.47
8.46
7.99 8.04 8.13
8.61
8.55
8.53
8.49
8.22
8
8
8.55
8.44
8.22
8.12
8.05
Conclusion
It c uld be show , that
selectivity of fragment io
Since this is a technique
selection, no signals are
possibilities for post acq
and untargeted approac
for General Unknown Sc
compromise.
References
1. B. Vogler, Master Th
Switzerland, 2013
nd waste water samples
s described earlier
1
.
n, a HPLC system was
utosampler (CTC analytics,
heos 2200 pump (Flux
separation a XBridge C18
article size) was used,
d methanol, both acidified
in Fig. 2.
is a Q Exactive quadrupole
as used. The final setup
the spray voltage being +
00 V (negative mode). The
20°C. S-lens-level was set
as 15 (arbitrary units) and
rbitrary units) for both
ts, full scan was recorded
m/z
200, while the data
coded with a resolution of
was recorded with a
00 and the fragment
esolution of 17,500 @
m/z
was recorded with a
0, automated gain control
ximal injection time was
rent numbers of data
ere recorded. Isolation
set according to Fig. 3.
m/z
200, AGC to 200,000
DIA Mode
In DIA mode different setups were evaluated. The
assumption was that with more windows with smaller
resulting isolation windows should yield better sensitivity
on the fragment ion signals. Since the ion flux is bigger on
the smaller masses while the mass range above
m/z
500
shows only low amount of matrix ions, the isolation
windows were kept small in the range below
m/z
500 with
only one bigger window for the range above
m/z
500 (see
Fig. 4).
All trademarks used are the property of Thermo
This information is not intended to encourage use
property rights of others.
Presented at RAFA, Prague, Czech Republic, No
Q Exactive mass
FIGURE 4. Isolation windows for different numbers of
isolation windows in DIA mode; the top row shows
the isolation window of the full scan (figure taken
from ef.
1
).
with eight windows (isol
chromatographic peak s
parent peak from the full
possible to even increas
number of isolation wind
in Fig. 7.
So in total there were eight experiments, starting with the
AIF experiment (row 1), covering the whole mass range
from
m/z
100 to 1000. The next experiment divided the
mass rage at
m/z
450 (row 2) and the following
experiments subdivided this range into an increasing
number of smaller isolation ranges, ending up with eight
windows, of which seven had an isolation width of 50 Da
(row 8).
FIGURE 5. Influence of the number of DIA windows on
the sensitivity of specific fragments on the example of
Morphine in a neat standard.
RT:
0.69 -2.10
1.0
.5
2.0
Time (min)
0
20
40
6
80
100
0
20
40
6
80
100
0
20
40
6
80
100
0
20
40
60
80
100
Relative Abundance
0
20
40
60
80
100
0
20
40
60
80
100
1.34
1.32
1.34
1.31
1.36
1.30
1.37
1.29
1.40
1.27
1.44
1.49
1.25
1.56
1.66
1.23
1.34
1.33
1.35
1.29
1.42
1.27
1.50
1.26
1.54
1.35
1.29
1.40
1.51
1.33
1.31
1.34
1.35
1.30
1.37
1.28
1.44
1.52
1.32
1.36
1.30
1.37
1.27
1.40
1.26
1.43
1.26
1.54 1.61
NL: 1.20E8
m/z=
286.1409-286.1467
F: FTMS + pESI Full
ms [100.00-1000.00]
MS 130516pos_004
NL: 0
m/z=
268.1306-268.1360
F: FTMS + pESI Full
ms2 MS
130516pos_004
NL: 2.39E6
m/z=
201.0892-201.0932
F: FTMS + pESI Full
ms2 MS
130516pos_004
NL: 1.03E6
m/z=
229.0838-229.0884
F: FTMS + pESI Full
ms2 MS
130516pos_004
NL: 2.66E6
m/z=
211.0734-211.0776
F: FTMS + pESI Full
ms2 MS
130516pos_004
NL: 3.50E6
m/z=
183.0787-183.0823
F: FTMS + pESI Full
ms2 MS
130516pos_004
RT:
0.70 -2.10
1.0
1.5
2.0
Time (min)
0
20
40
6
80
100
0
20
40
6
80
100
0
20
40
6
80
100
0
20
40
60
80
100
Relative Abundance
0
20
40
60
80
100
0
20
40
60
80
100
1.32
1.31
1.34
1.29
1.35
1.27 1.37
1.39
1.26
1.41
1.25
1.47
1.23
1.55
1.67
1.34
1.31
1.38
1. 1
1.45
1.27
1.31
1.31
1.30
1.36
1.27 1.36
1.40
1.26
1.24
1.54
1.55
1.23
1.76
1.32
1.33
1.29
1.34
1.35
.36
1.29
1.38
. 7
1.41
1.26
1.50
1.74
1.24
1.32
1.33
1.29 1.36
6
1.27
1.24
1.47 1.75
1.31
1.36
1.28
1.27
1.39
1.53
1.24
1.73
NL: 1.27E8
m/z=
286.1409-286.1467
F: FTMS +p ESI Full
ms[100.00-1000.00]
MS 130516pos_005
NL: 1.89E6
m/z=
268.1306-268.1360
F: FTMS +p ESI Full
ms2 MS
130516pos_005
NL: 5.27E6
m/z=
201.0892-201.0932
F: FTMS +p ESI Full
ms2 MS
130516pos_005
NL: 5.28E6
m/z=
229.0838-229.0884
F: FTMS +p ESI Full
ms2 MS
130516pos_005
NL: 2.53E6
m/z=
211.0734-211.0776
F: FTMS +p ESI Full
ms2 MS
130516pos_005
NL: 9.76E5
m/z=
183.0787-183.0823
F: FTMS +p ESI Full
ms2 MS
130516pos_005
RT:
0.69 -2.12
1.0
1.5
2.0
Time (min)
0
20
40
6
80
100
0
20
40
6
80
100
0
20
40
6
80
100
0
20
40
60
80
100
Relative Abundance
0
20
40
60
80
100
0
20
40
60
80
100
1.33
1.32
1.34
1.35
1.29
1.36
1.28
1.26 1.39
1.41
1.25
1.44
1.52
1.23
1.60
1.20
1.32
1.33
1.31 1.36
1.38
1.27
1.40
1.26
1.44
1.25
1.45
1.24
1.52
1.23
2.10
1.32
1.33
1.31
1.29 1.34
1.36
1.27 . 7
1.26
1.40
1.25
1.47
1.24
1.56
1.22
1.77
1.32
1.31 1.34
1.35
1.28
1.36
1.39
1.26
1.42
1.47
1.24
1.56
1.22
1.78
1.33
1.32
1.29
1.34
1.36
1.27
. 6
1.39
1.45
1.24
1.50
1.60
1.22
1.32
1.29
1.35
1.27
1.38
1.39
1.26
1.25
1.44
1.23
1.54
2.08
NL: 1.19E8
m/z=
286.1409-286.1467
F: FTMS +p ESI Full
ms [100.00-1000.00]
MS 130516pos_008
NL: 8.52E5
m/z=
268.1306-268.1360
F: FTMS +p ESI Full
ms2 MS
130516pos_008
NL: 4.61E6
m/z=
201.0892-201.0932
F: FTMS +p ESI Full
ms2 MS
130516pos_008
NL: 3.09E6
m/z=
229.0838-229.0884
F: FTMS +p ESI Full
ms2 MS
130516pos_008
NL: 1.88E6
m/z=
211.0734-211.0776
F: FTMS +p ESI Full
ms2 MS
130516pos_008
NL: 1.30E6
m/z=
183.0787-183.0823
F: FTMS +p ESI Full
ms2 MS
130516pos_008
RT:
0.69 -2.12
1.0
1.5
2.0
Time (min)
0
20
40
6
80
100
0
20
40
60
80
100
0
20
40
6
80
100
0
20
40
60
80
100
Relative Abundance
0
20
40
60
80
100
0
20
40
60
80
100
1.31 1.33
1.30
1.34
1.29
1.27
1.36
1.26
1.39
1.25
1.41
1.47
1.23
1.54
1.76
1.21
1.32
1.31
1.34
1.30
1.35
1.27
1.37
1.38
.25
.41
1.48
1.23
1.80
1.32
1.31
1.34
1. 0
1.27 1.35
1.37
1.25
1.39
1.24
1.44
1.23
1.51
1.58
1.20
1.79
0.89
1.30 1.32
1.28
1.27 1.35
1.25
. 8
1.41
4
1.48
1.23
1.57 1.71
1.20
1.32
1.31
1.34
1.27
1.37
1.25
1.39
4
1.44
1.51
1.23
2.08
1.30 1.32
1.28
1.35
1.27
1.37
1.25
1.41
1.24
1.50
1.23
1.55 1.71
NL: 1.21E8
m/z=
286.1409-286.1467
F: FTMS + pESI Full
ms [100.00-1000.00]
MS 130516pos_010
NL: 9.15E5
m/z=
268.1306-268.1360
F: FTMS + pESI Full
ms2 MS
130516pos_010
NL: 3.73E6
m/z=
201.0892-201.0932
F: FTMS + pESI Full
ms2 MS
130516pos_010
NL: 2.64E6
m/z=
229.0838-229.0884
F: FTMS + pESI Full
ms2 MS
130516pos_010
NL: 1.71E6
m/z=
211.0734-211.0776
F: FTMS + pESI Full
ms2 MS
130516pos_010
NL: 1.12E6
m/z=
183.0787-183.0823
F: FTMS + pESI Full
ms2 MS
130516pos_010
1 window 2 windows 5 windows 7 windows
FIGURE 7. Interferenc
number of isolation wi
RT:
7.87 - 9.79
SM:
5G
8.0
8.2
8.4
0
50
100
0
50
100
0
50
100
Relative Abundance
0
50
100
8.6
8.
8.5
8.5
8.54
8.50
8.15
8.09
8.23
.
8.
8.51
8.47
8.46
7.99 8.04 8.13
8.61
8.55
8.53
8.49
8.22
8
8.
8.55
8.44
8.22
8.12
8.05
Conclusion
It could be shown, that wi
selectivity of fragment ion
Since this is a technique
selection, no signals are f
possibi ities for post acqui
and un argeted pproach
for General Unknown Scr
compromise.
Referenc s
1. B. Vogler, Master The
Switzerland, 2013
described earlier
1
.
, a HPLC system was
tosampler (CTC analytics,
eos 2200 pump (Flux
ep ration a XBridge C18
rticle size) was used,
methanol, both acidified
n Fig. .
s a Q Exactive quadrupole
s used. The final setup
he spray voltage being +
0 V (negative mode). The
0°C. S-lens-le l w s set
s 15 (arbitrary units) and
bitrary units) for b th
s, full scan was r corded
m/z
200, while the data
oded with a resolution of
a recorded ith a
0 and the fragment
solution of 17,500 @
m/z
as recorded with a
, automated gain control
imal injection time was
ent numbers of data
re rec rded. Isolation
et ccording to Fig. 3.
m/z
200, AGC o 200,000
0 ms.
assumption was that with more windows with smaller
resulting isolation windows should yield better sensitivity
on the fragm nt ion signals. Since th ion flux is bigger on
the maller mass s whil he mass range above
m/z
500
shows only lo mount of mat ix io s, the isolation
windows were kept small in the range below
m/z
500 with
only one bi ger w ndo for t e range b ve
m/z
500 (see
Fig. 4).
All trademarks used are the property of Thermo Fis
This information is not intended to encourage use of
property rights of others.
Presented at RAFA, Prague, Czech Republic, Nov5
Q Exactive mass
FIGURE 4. Isolation windows for different numbers of
isolation windows in DIA mode; the top row shows
the isolation window of the full scan (figure taken
from Ref.
1
).
par nt peak from the full
pos ible to even increase
number of isolati n windo
in Fig. 7.
So in total there were eight experiments, starting with the
AIF experiment (row 1), covering the whole mass range
from
m/z
100 to 1000. The next experiment divided the
mass rage at
m/z
450 (row 2) and the following
experiments subdivid d this range into an incre ing
number of s aller isolation ranges, ending up with eig t
windows, of which seven had an isolation width of 50 Da
(row 8).
FIGURE 5. Influence of the number of DIA windows on
the sensitivity of specific fragments on the example of
Morphine in a neat standard.
RT:
0.69 -2.10
1.0
1.5
2.0
Time (min)
0
20
40
60
80
100
0
20
40
60
80
100
0
20
40
60
80
100
0
20
40
60
80
100
Relative Abundance
0
20
40
60
80
100
0
20
40
60
80
100
1.34
1.32
1.34
1.31
1.36
1.30
1.37
1.29
1.40
1.27
1.44
1.49
1.25
1.56
1.66
1.23
1.34
1.33
1.35
1.29
1.42
1.27
1.50
1.26
1.54
1.35
1.29
1.40
1.51
1.33
1.31
1.34
1.35
1.30
1.37
1.28
1.44
1.52
1.32
1.36
1.30
1.37
1.27
1.40
1.26
1.43
1.26
1.54 1.61
NL: 1.20E8
m/z=
286.1409-286.1467
F: FTMS + pESI Full
ms [100.00-1000.00]
MS 130516pos_004
NL: 0
m/z=
268.1306-268.1360
F: FTMS + pESI Full
ms2 MS
130516pos_004
NL: 2.39E6
m/z=
201.0892-201. 932
F: FTMS + pESI Full
ms2 MS
130516pos_004
NL: 1.03E6
m/z=
229.0838-229.0884
F: FTMS + pESI Full
ms2 MS
130516pos_004
NL: 2.66E6
m/z=
211.0734-211.0776
F: FTMS + pESI Full
ms2 MS
130516pos_004
NL: 3.50E6
m/z=
183.0787-183.0823
F: FTMS + pESI Full
ms2 MS
130516pos_004
RT:
0.70 -2.10
1.0
1.5
2.0
Time (min)
0
20
40
60
80
100
0
20
40
60
80
100
0
20
40
60
80
100
0
20
40
60
80
100
Relative Abundance
0
20
40
60
80
100
0
20
40
60
80
100
1.32
1.31
1.34
1.29
1.35
1.27 1.37
1.39
1.26
1.41
1.25
1.47
1.23
1.55
1.67
1.34
1.31
1.38
1.31
1.45
1.27
1.31
1.31
1.30
1.36
1.27 1.36
1.40
1.26
1.24
1.54
1.55
1.23
1.76
1.32
1.33
1.29
4
1.35
1.36
1.29
1.38
1.27
1.41
1.26
.50
1.74
1.24
1.32
1.33
1.29 1.36
1.36
1.27
1.24
1.47 1.75
1.31
1.36
1.28
1.27
1.39
1.5
1.24
1.73
NL: 1.27E8
m/z=
286.1409-286.1467
F: FTMS +p ESI Full
ms[100.00-1000.00]
MS 130516pos_005
NL: 1.89E6
m/z=
268.1306-268.1360
F: FTMS +p ESI Full
ms2 MS
130516pos_005
NL: 5.27E6
m/z=
201.0892-201.0932
F: FTMS +pESI Full
ms2 MS
130516pos_005
NL: 5.28E6
m/z=
229.0838-229.0884
F: FTMS +pESI Full
ms2 MS
130516pos_005
NL: 2.53E6
m/z=
211.0734-211.0776
F: FTMS +pESI Full
ms2 MS
130516pos_005
NL: 9.76E5
m/z=
183.0787-183.0823
F: FTMS +pESI Full
ms2 MS
130516pos_005
RT:
0.69 -2.12
1.0
1.5
2.0
Time (min)
0
20
40
60
80
100
0
20
40
60
80
100
0
20
40
60
80
100
0
20
40
60
80
100
Relative Abundance
0
20
40
60
80
100
0
20
40
60
80
100
1.33
1.32
1.34
1.35
1.29
1.36
1.28
1.26 1.39
1.41
1.25
1.44
1.52
1.23
1.60
1.20
1.32
1.33
1.31 1.36
1.38
1.27
1.40
1.26
1.44
1.25
1.45
1.24
1.52
1.23
2.10
1.32
. 3
1.31
1.29 1.34
1.36
1.27 1.37
1.26
1.40
1.25
1.47
1.24
1.56
1.22
1.77
1.32
1.31 .34
1.35
1.28
1.36
1.39
1.26
1.42
1.47
1.24
1.56
1.22
1.78
1.33
1.32
1.29
1.34
1.36
1.27
1.26
1.39
1.45
1.24
1.50
1.60
1.22
1.32
1.29
1.35
1.27
1.38
1.39
1.26
1.25
1.44
1.23
1.54
2.08
NL: 1.19E8
m/z=
286.1409-286.1467
F: FTMS +p ESI Full
ms [100.00-1000.00]
MS 130516pos_008
NL: 8.52E5
m/z=
268.1306-268.1360
F: FTMS +p ESI Full
ms2 MS
130516pos_008
NL: 4.61E6
m/z=
201.0892-201.0932
F: FTMS +pESI Full
ms2 MS
130516pos_008
NL: 3.09E6
m/z=
229.0838-229.0884
F: FTMS +pESI Full
ms2 MS
130516pos_008
NL: 1.88E6
m/z=
211.0734-211.0776
F: FTMS +pESI Full
ms2 MS
130516pos_008
NL: 1.30E6
m/z=
183.0787-183.0823
F: FTMS +pESI Full
ms2 MS
130516pos_008
RT:
0.69 -2.12
1.0
1.5
2.0
Time (min)
0
20
40
60
80
100
0
20
40
60
80
100
0
20
40
60
80
100
0
20
40
60
80
100
Relative Abundance
0
20
40
60
80
100
0
20
40
60
80
100
1.31 1.33
1.30
1.34
1.29
1.27
1.36
1.26
1.39
1.25
1.41
1.47
1.23
1.54
1.76
1.21
1.32
1.31
1.34
1.30
1.35
1.27
1.37
1.38
1.25
1.41
1.48
1.23
1.80
1.32
1.31
1.34
1.30
1.27 1. 5
1.37
1.25
1.39
1.24
1.44
1.23
1.51
1.58
1.20
1.79
0.89
1.30 1.32
1.28
1.27 1.35
1.25 1.38
.41
1.24
1.48
1.23
1.57 1.71
1.20
1.32
1.31
1.34
1.27
1.37
1.25
1.39
1.24
1.44
1.51
1.23
2.08
1.30 1.32
1.28
1.35
1.27
.37
1.25
1.41
1.24
1.50
1.23
1.55 1.71
NL: 1.21E8
m/z=
286.1409-286.1467
F: FTMS + pESI Full
ms [100.00-1000.00]
MS 130516pos_010
NL: 9.15E5
m/z=
268.1306-268.1360
F: FTMS + pESI Full
ms2 MS
130516pos_010
NL: 3.73E6
m/z=
201.0892-201.0932
F: FTMS + pESI Full
ms2 MS
130516pos_010
NL: 2.64E6
m/z=
229.0838-229.0884
F: FTMS + pESI Full
ms2 MS
130516pos_010
NL: 1.71E6
m/z=
211.0734-211.0776
F: FTMS + pESI Full
ms2 MS
130516pos_010
NL: 1.12E6
m/z=
183.0787-183.0823
F: FTMS + pESI Full
ms2 MS
130516pos_010
1 window 2 windows 5 windows 7 windows
FIGURE 7. Interference
number of isolation win
RT:
7.87 - 9.79
SM:
5G
8.0
8.2
8.4
8
0
50
100
0
50
100
0
50
100
Relative Abundance
0
50
100
8.61
8.60
8.58
8.56
8.54
8.50
8.15
8.09
8.23
8.63
8.59
8.51
8.47
8.46
7.99 8.04 8.13
8.
8.
8.61
8.55
8.53
8.49
8.22
8.6
8.
8.
. 9
8.55
8.44
8.22
8.12
8.05