


 198 / 302

4
Enhancing General Unknown Screening with Data Independent Analysis on a Quadrupole Orbitrap Mass Spectrometry System
known screening
ical All Ion Fragmentation
amples were measured with
omparison.
ves for the most versatile data
ing as well as for targeted
e
nmental and food samples
sis of larger sets of analytes
velopments in scan speed of
trometry systems have
t even more the steadily
ution accurate mass (HRAM)
ntation (mainly TOF and
ts) in residue analysis leads to
is field as well into new
allenges is the confirmation
precursor ion selected
echnical limits in terms of the
omes impossible in case of
regarded. The alternative of
rsor ion selection (as “All Ion
s proven to be very powerful
ns in sensitivity of fragments
nents. In the Data
A) scan mode of a Thermo
ass spectrometric system, the
ed into smaller ranges,
o 100 Daltons. This enhances
agment scans, resulting in
of the significant fragments
rmation. At the same time all
g or even General Unknown
able as in AIF.
r and waste water samples
d as described earlier
1
.
tion, a HPLC system was
al autosampler (CTC analytics,
Results
All Ion Fragmentation (AIF)
First, data was acquired in AIF mode as described. After
acquisition, extracted ion chromatograms were generated
for the quasimolecular ion and specific ions for a number
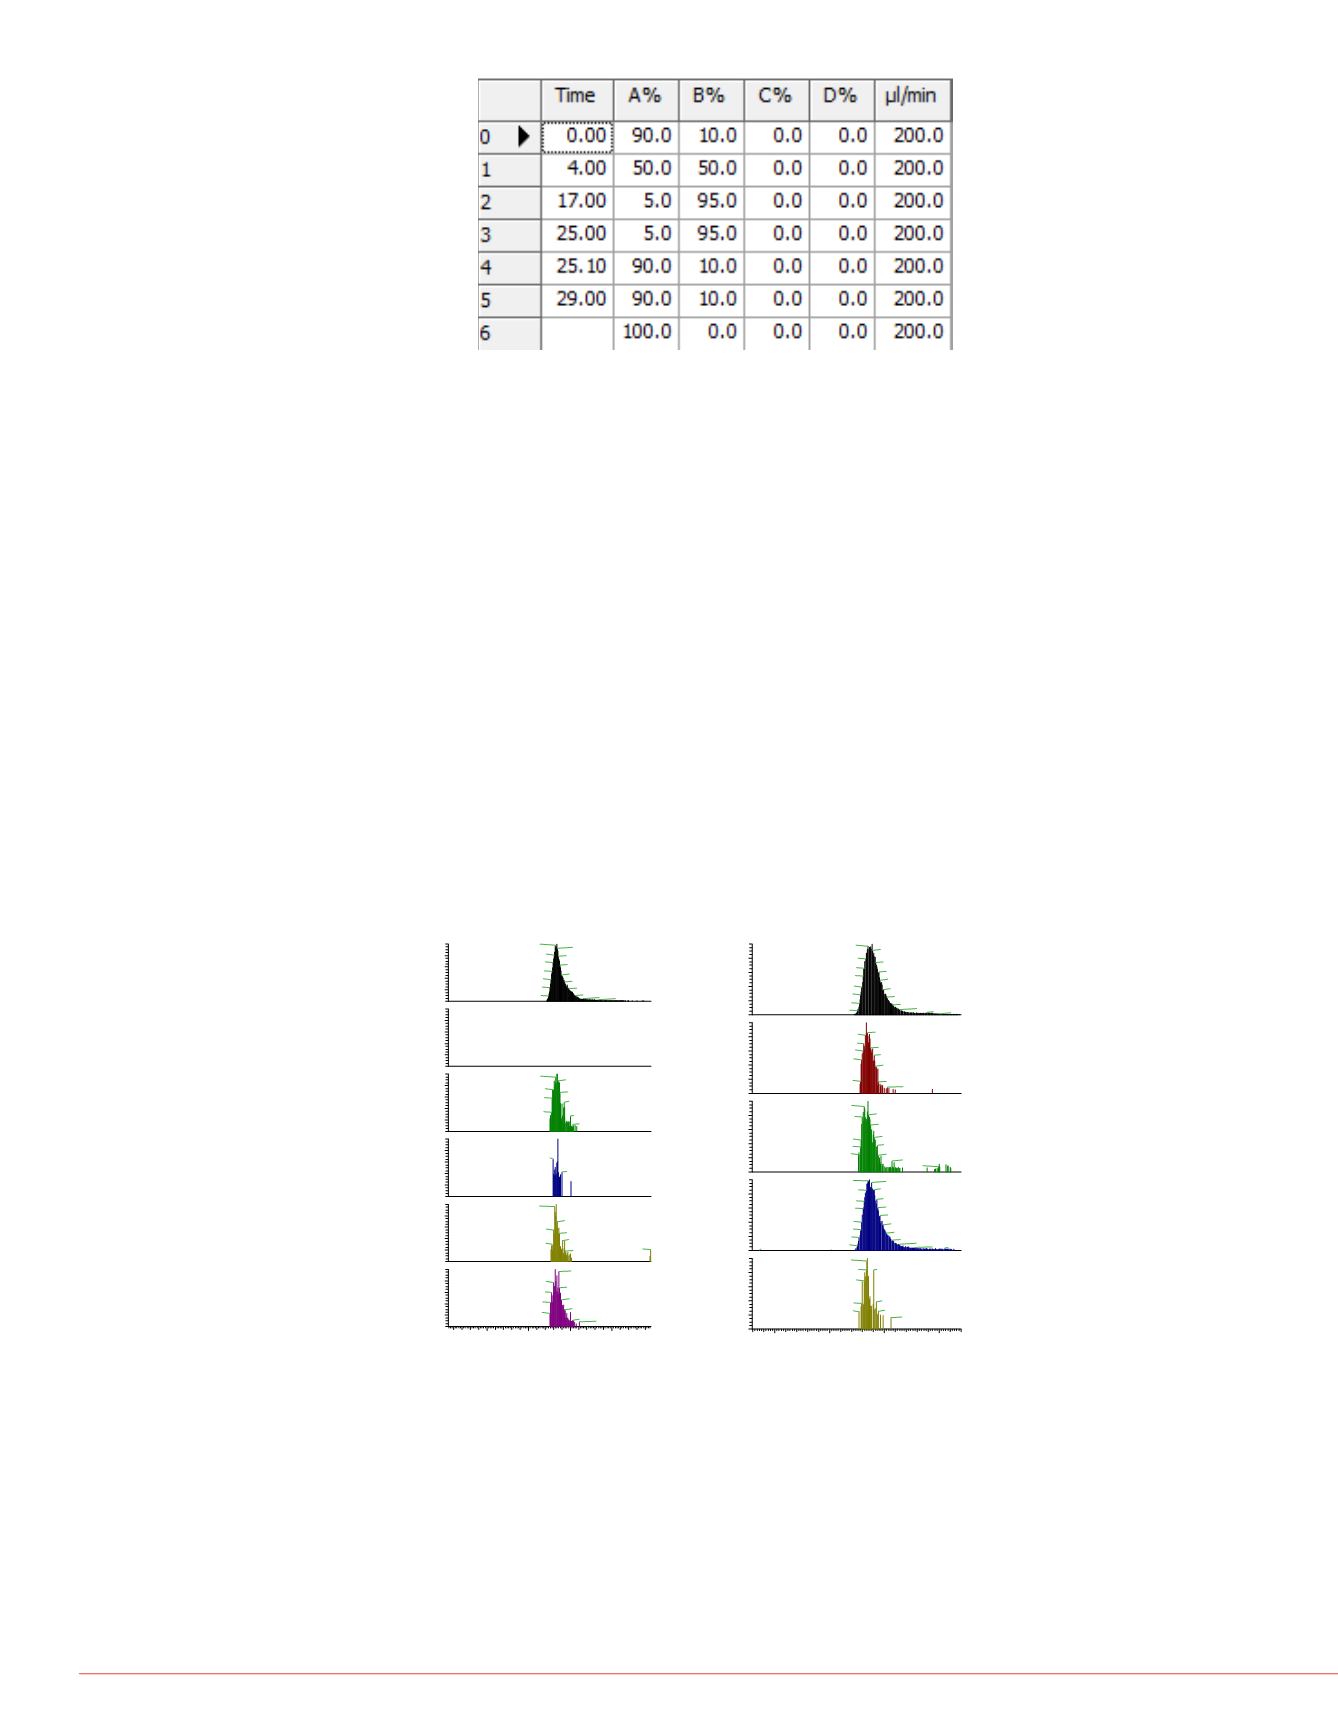
of compounds. Fig. 3 shows the XICs for Morphine and
Sotalol as an example. Some of the fragments are missing
completely and some show an irregular peak shape than
the one of the quasimolecular ion, because the signal
intensity is significant lower, although the concentration of
the used standard was 500 ng/L.
DIA Mode
In DIA mode different setups were evaluated. The
assumption was that with more windows with smaller
resulting isolation windows should yield better sensitivity
on the fragment ion signals. Since the ion flux is bigger on
the smaller masses while the mass range above
m/z
500
shows only low amount of matrix ions, the isolation
As shown in Fig. 5, wi
leading to smaller win
in intensity and their p
shape of the signal fr
evidence that the frag
respective quasimole
difference in signal qu
and a 7 window exper
be on the 5 window e
and the resulting data
experiment times yiel
was no surprise, that
shortest cycle time wi
window DIA experime
the 5 window experim
with about 650 ms. F
dependent Top 5 MS
2
had a cycle time of m
in the small isolation
very long ion times.
FIGURE 2. Gradient settings for the chromatographic
separation.
RT:
0.03 - 2.47
0.5
1.0
1.5
2.0
Time (min)
0
20
40
60
80
100
0
20
40
60
80
100
0
20
40
60
80
100
0
20
40
60
80
100
RelativeAbundance
0
20
40
60
80
100
0
20
40
60
80
100
1.34
1.32
1.34
1.30 1.36
1.29 1.37
1.28
1.40
1.27
1.43
1.26
1.48
1.56
1.24
1.66 1.84 2.30
1.34
1.33
1.35
1.29 1.38
1.28
1.42
1.27
1.50
1.54
1.35
1.29
1.40
1.51
1.33
1.31
1.34
1.30
1.37
1.41
1.28
2.47
1.44
1.32
1.36
1.30
1.37
1.27
1.40
1.26
1.43
1.26
1.54 1.61
NL: 1.20E8
m/z=
286.1409-286.1467F:
FTMS+pESIFullms
[100.00-1000.00] MS
130516pos_004
NL: 0
m/z=
268.1306-268.1360F:
FTMS+pESIFull
ms2 MS
130516pos_004
NL: 2.39E6
m/z=
201.0892-201.0932F:
FTMS+pESIFull
ms2 MS
130516pos_004
NL: 1.03E6
m/z=
229.0838-229.0884F:
FTMS+pESIFull
ms2 MS
130516pos_004
NL: 2.66E6
m/z=
211.0734-211.0776F:
FTMS+pESIFull
ms2 MS
130516pos_004
NL: 3.50E6
m/z=
183.0787-183.0823F:
FTMS+pESIFull
ms2 MS
130516pos_004
RT:
0.79 -2.70
1.0
1.5
2.0
2.5
Time (min)
0
20
40
60
80
100
0
20
40
60
80
100
0
20
40
60
80
100
RelativeAbundance
0
20
40
60
80
100
0
20
40
60
80
100
1.89
1.85
1.89
1.83
1.92
1.82
1.95
1.81
1.96
1.80
1.98
1.78
2.02
1.77
2.08
2.14
1.76
2.39 2.51
1.26
1.83
1.85
1.83
1.81
1.87
1.81
1.91
1.79
1.92
1.78
1.95
2.03
2.44
1.85
1.82
1.86
1.80
1.87
1.91
1.79
1.94
1.78
1.77
1.95
2.07
2.50
2.49
1.86
1.86
1.89
1.91
1.83
1.93
1.82
1.94
1.81
1.96
1.79
1.99
1.79
2.02
1.77
2.07
2.14
1.75
2.28 2.55
1.52
0.86
1.85
1.84
1.83 1.90
1.82
1.93
1.79
1.95
1.77
2.06
NL:1.51E8
m/z=
273.1250-273.1304
F: FTMS +pESI Full
ms [100.00-1000.00]
MS130516pos_004
NL:2.57E6
m/z=
255.1135-255.1187
F: FTMS +pESI Full
ms2 MS
130516pos_004
NL:3.84E6
m/z=
213.0672-213.0714
F: FTMS +pESI Full
ms2 MS
130516pos_004
NL:5.27E7
m/z=
133.0747-133.0773
F: FTMS +pESI Full
ms2 MS
130516pos_004
NL:1.21E6
m/z=
176.1289-176.1325
F: FTMS +pESI Full
ms2 MS
130516pos_004
FIGURE 3. Parent ions (top row) and fragment ions for
Morphine (A) and Sotalol (B) in AIF mode
A
B
Another question was
selectivity could be in
insect repellant DEE
fragment
m/z
119.049
shoulder was visible
the parent ion. This in
first with increasing th
with eight windows (i
chromatographic pea
parent peak from the
possible to even incr
number of isolation w
in Fig. 7.
FIGURE 6. Cycle tim
DDA: data depende
with according num
numbers in the box