


 134 / 302

Part of Thermo Fisher Scientific
www.thermoscientific.comLegal Notices: ©2011 Thermo Fisher Scientific Inc. All rights reserved. All trademarks are the property of Thermo Fisher Scientific Inc. and its subsidiaries. This
information is presented as an example of the capabilities of Thermo Fisher Scientific Inc. products. It is not intended to encourage use of these products in any
manners that might infringe the intellectual property rights of others. Specifications, terms and pricing are subject to change. Not all products are available in all
countries. Please consult your local sales representative for details.
Thermo Fisher Scientific,
San Jose, CA USA is ISO Certified.
AN63478_E 09/11S
In addition to these
offices, Thermo Fisher
Scientific maintains
a network of represen
tative organizations
throughout the world.
Africa-Other
+27 11 570 1840
Australia
+61 3 9757 4300
Austria
+43 1 333 50 34 0
Belgium
+32 53 73 42 41
Canada
+1 800 530 8447
China
+86 10 8419 3588
Denmark
+45 70 23 62 60
Europe-Other
+43 1 333 50 34 0
Finland/Norway/
Sweden
+46 8 556 468 00
France
+33 1 60 92 48 00
Germany
+49 6103 408 1014
India
+91 22 6742 9434
Italy
+39 02 950 591
Japan
+81 45 453 9100
Latin America
+1 561 688 8700
Middle East
+43 1 333 50 34 0
Netherlands
+31 76 579 55 55
New Zealand
+64 9 980 6700
Russia/CIS
+43 1 333 50 34 0
South Africa
+27 11 570 1840
Spain
+34 914 845 965
Switzerland
+41 61 716 77 00
UK
+44 1442 233555
USA
+1 800 532 4752
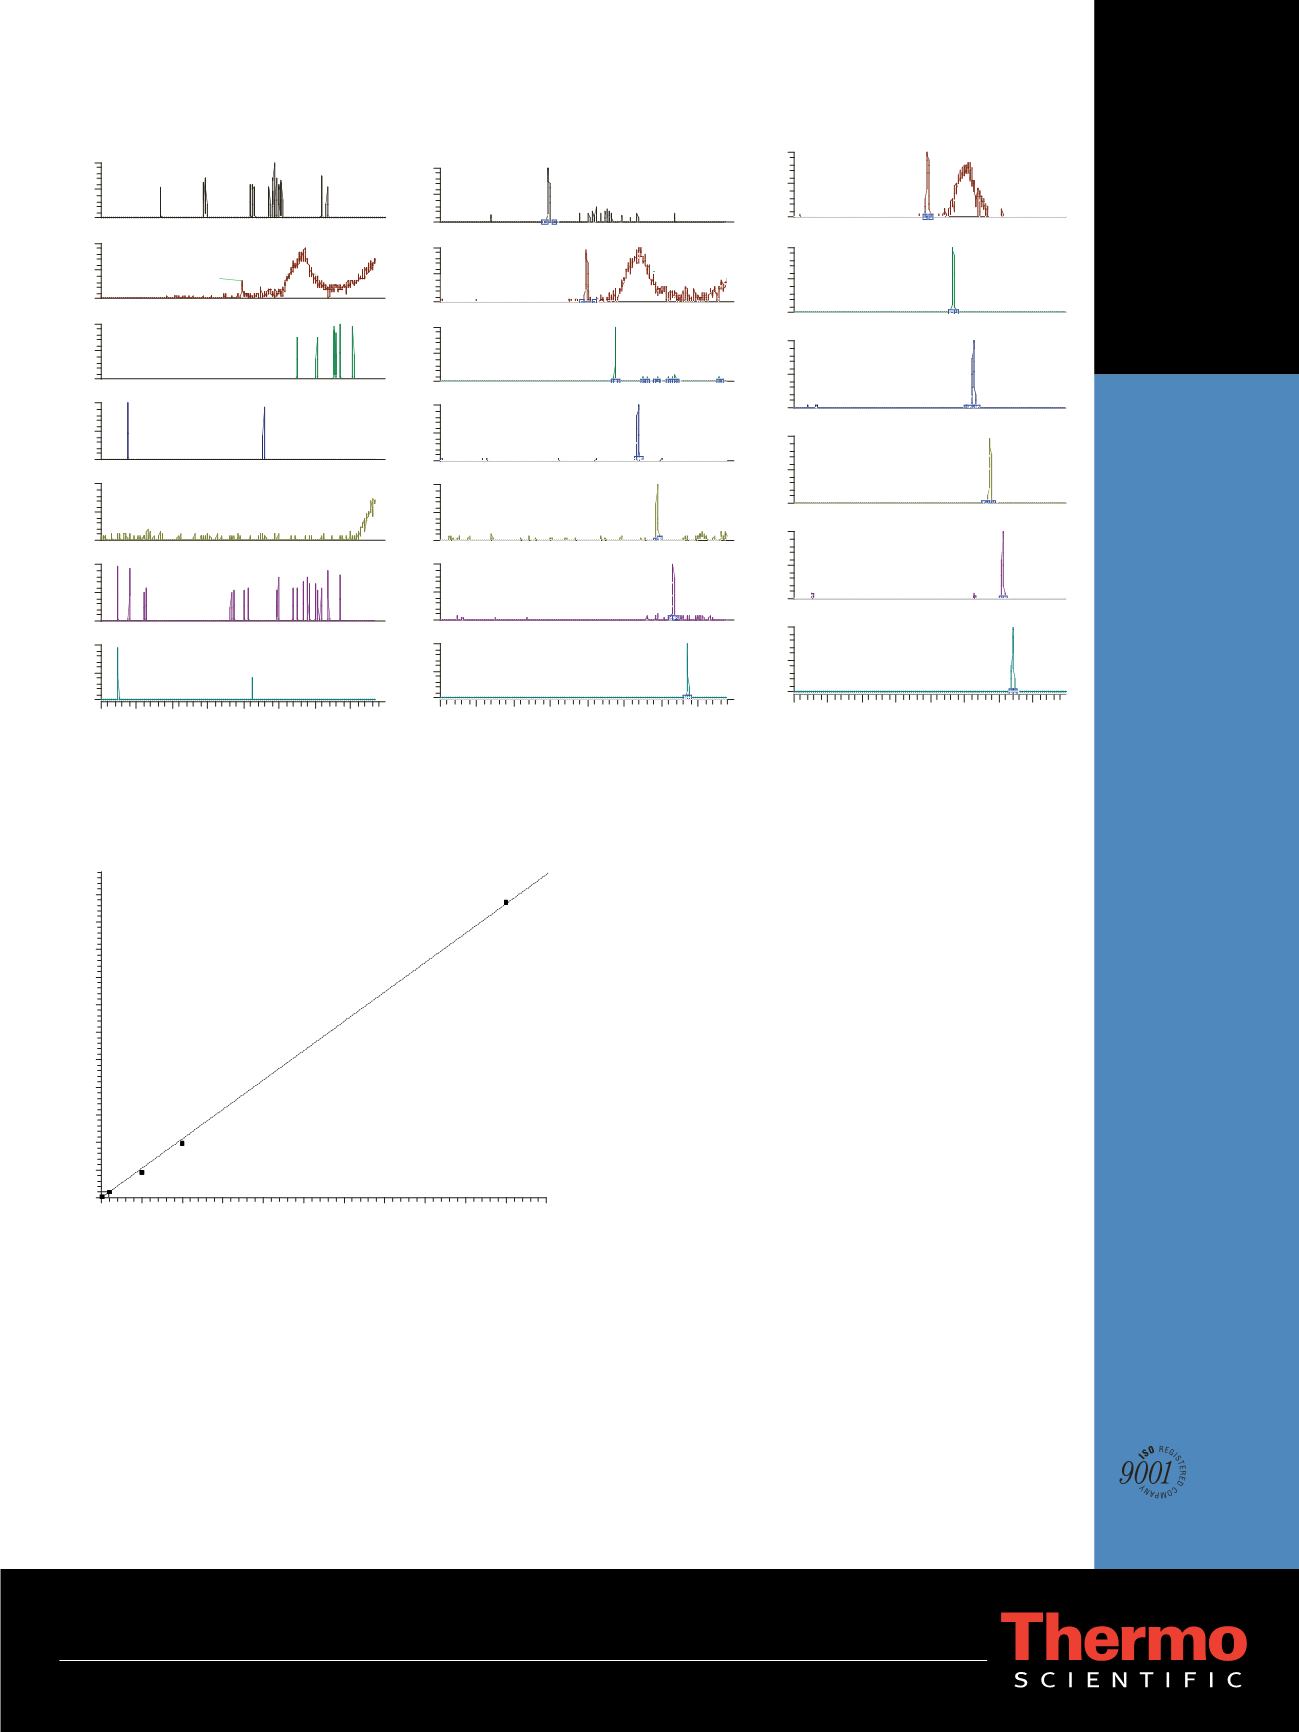
Conclusion
Full scan in negative mode LC-MS acquisition on the
Exactive LC-MS system with Orbitrap technology is
suitable for quantification of PFAAs at low concentrations
ranging from 0.1 µg/kg to 50 µg/kg in complex matrix
extracts. No tuning or fragment determination is required
and there is less background with high-resolution, accurate
mass acquisition.
Reference
1. Bossi, R.; Riget, F.F.; Dietz, R.; Sonne, C.; Fauser, P.; Dam, M.;
Vorkamp, K.
Environmental Pollution
2005
,
136,
323-329.
0
1
2
3
4
5
6
7
Time (min)
0
50
100
0
50
100
0
50
100
0
50
100
0
50
100
0
50
100
0
50
100
RT:2.95
BP:362.9700
4.23
362.9704
6.37
362.9687
1.41
362.9699
RT:3.98
BP:412.9680
5.42
412.9666
5.79
412.9662
0.07
412.9653
3.71
412.9654
RT:4.76
BP:462.9638
RT:6.40
BP:462.9633
RT:5.39
BP:512.9619
RT:5.90
BP:562.9578
RT:6.33
BP:612.9547
RT:6.71
BP:662.9509
0
1
2
3
4
5
6
7
Time (min)
0
50
100
0
50
100
0
50
100
0
50
100
Relative Abundance
0
50
100
0
50
100
0
50
100
4.86
362.9683
6.19
362.96
2.95
362.9680
1.69
362.9678
7.90
412.9671
5.72
412.9665
5.27
412.9664
5.99
412.9672
3.98
412.9661
1.88
412.9679
6.72
462.9635
6.06
462.9648
0.77
512.9608
4.57
512.9587
0.50
662.9536
4.27
662.9530
0
1
2
3
4
5
6
7
Time (min)
0
50
100
0
50
100
0
50
100
0
50
100
0
50
100
0
50
100
RT:3.93
BP:412.9674
RT:4.66
BP:462.9639
RT:5.27
BP:512.9612
RT:5.75
BP:562.9581
RT:6.12
BP:612.9557
RT:6.42
BP:662.9503
PFHpA
PFOA
PFNA
PFDA
PFUnA
PFDoA
PFTrA
PFHpA
PFOA
PFNA
PFDA
PFUnA
PFDoA
PFTrA
PFOA
PFNA
PFDA
PFUnA
PFDoA
PFTrA
PFOA
Y=0.0106602*X R^2=0.9993 W:Equal
0
5
10
15
20
25
30
35
40
45
50
55
0.00
0.05
0.10
0.15
0.20
0.25
0.30
0.35
0.40
0.45
0.50
0.55
AreaRatio
µg/kg
Figure 5. Extracted chromatograms: (a) Blank, (b) Standard, (c) Arctic seal extract
Figure 6. Calibration curve for PFOA
a) Blank
b) Standard
c) Arctic Seal Extract