


 139 / 302

Analysis of PFCs in Human Milk Matrix
To evaluate the applicability of this technique to complex
matrices, the SRM assays were used to analyze and
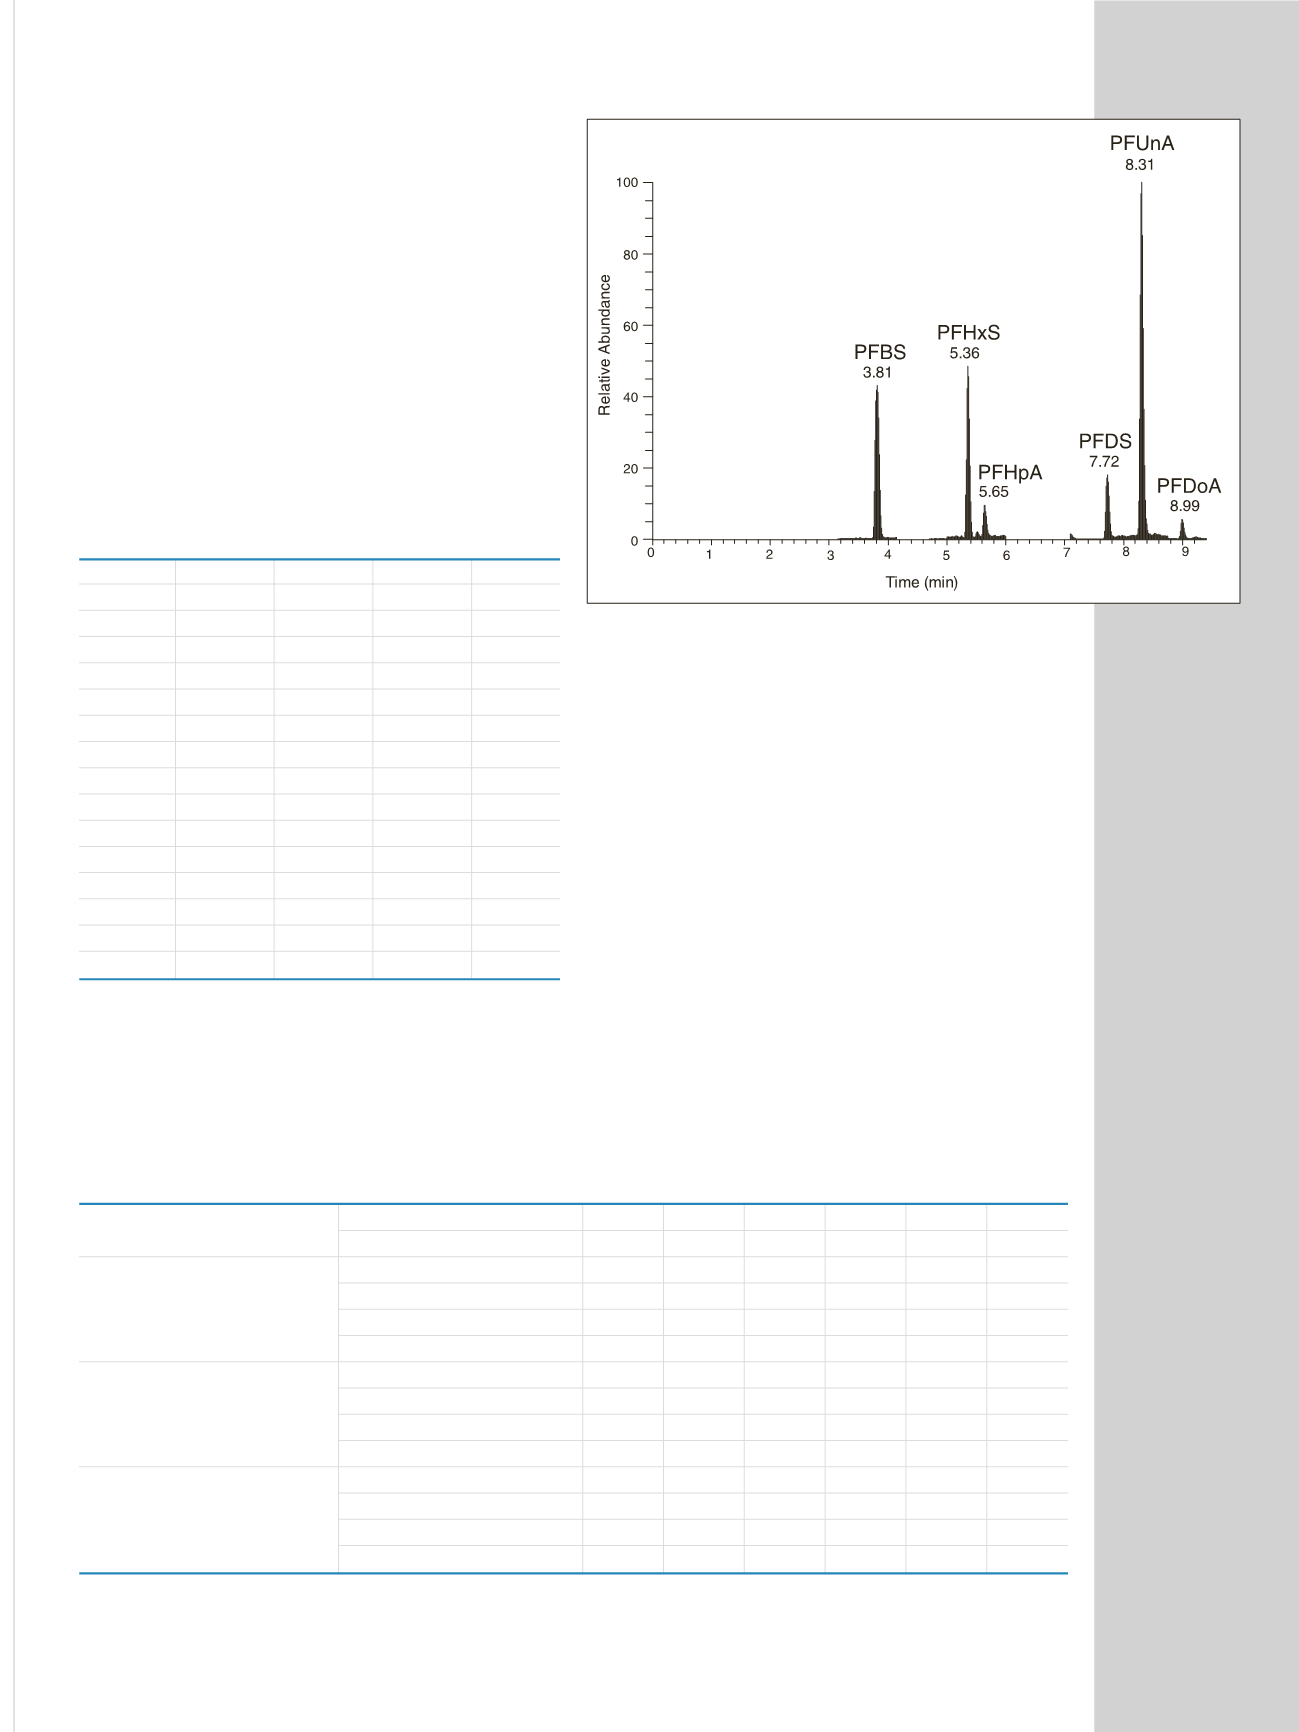
quantitate PFCs in human breast milk. UHPLC separation
of the six PFC analytes in a spiked milk matrix was
achieved within 9 minutes (Figure 5). All analytes were
baseline resolved using the optimized LC method.
Reproducibility was investigated by analyzing fifteen
replicate injections of a spiked matrix (Table 3). Peak
area RSDs for compounds and internal standards were
10.8% and 11.0% respectively, the response ratio RSD
was 1.29%, and retention time RSD was 0.29%,
indicating excellent method and system reproducibility,
particularly of the LC pump.
Table 4 summarizes the concentrations of the PFCs
detected in a human milk sample (Matrix A). PFBS,
PFHxS, PFHpA, PFDS, and PFUnA were detected at
concentrations of less than 60 ppt, while PFDoA was
not found to be present in the sample. Assay accuracy
was investigated using spiked milk matrices B, C, and D
and internal and external standards (Table 3). For PFHxS
and PFUnA, the two PFCs for which internal standards
were available, using the internal standard method was
significantly more accurate (98–110%) than the external
standard method (81–144%) in the concentration range
0.1–1.0 ng/mL. While internal standards eliminate the
matrix effect to facilitate greater quantitative accuracy,
they are expensive and may be difficult to obtain.
Using the external standard method, the accuracy of
all PFC analytes was 81–144% in the concentration
range 0.1–1.0 ng/mL.
File
Peak
ISTD Response
RT
Name
Area
Area
Ratio
(Min)
Mark D_0 17 149 369
8 268 9
1.806
8.29
Mark D_0 18 147 075
8 081 9
1.820
8.27
Mark D_0 19 145 882
8 127 6
1.795
8.29
Mark D_0 20 146 012
7 990 7
1.827
8.29
Mark D_0 21 143 987
8 071 2
1.784
8.27
Mark D_0 22 143 095
8 011 6
1.786
8.25
Mark D_0 23 140 298
7 802 3
1.798
8.25
Mark D_0 67 121 597
6 929 2
1.755
8.25
Mark D_0 68 119 763
6 776 4
1.767
8.29
Mark D_0 69 119 149
6 654 3
1.791
8.27
Mark D_0 70 121 775
6 647 6
1.832
8.32
Mark D_0 71 113 885
6 376 6
1.786
8.27
Mark D_0 72 115 138
6 271 2
1.836
8.31
Mark D_0 73 116 884
6 561 6
1.781
8.24
Mark D_0 74 114 601
6 358 6
1.802
8.31
RSD% 11
10.8
1.29
0.29
Table 3: Reproducibility (RSD) of instrument performance for fifteen replicate
injections of Matrix D. Peak area is the LC peak area response for fifteen
injections. Peak area was used for quantitation, both for the internal standard
method and external standard method. ISTD area = peak area of the internal
standard. Response ratio is the peak area of the compounds over the peak
area of the internal standard, and was used for quantitation with the
internal standard method. RT = retention time.
PFBS
PFHxS
PFHpA
PFDS
PFUnA
PFDoA
Matrix A
(unknown)
Measured value with IS (ppt)
48.0
12.0
Measured value with ES (ppt)
10.0
40.0
50.0
50.0
35.0
0.0
Matrix B
(Matrix A + spiked 100 ppt)
Measured value with IS (ppt)
152
115
Measured value with ES (ppt)
110
145
185
150
195
130
Method Accuracy with IS (%)
103
103
Method Accuracy with ES (%)
100
104
123
100
144
130
Matrix C
(Matrix A + spiked 300 ppt)
Measured value with IS (ppt)
382
340
Measured value with ES (ppt)
260
290
365
285
420
280
Method Accuracy with IS (%)
110
109
Method Accuracy with ES (%)
84
85
104
81
125
93
Matrix D
(Matrix A + spiked 1000 ppt)
Measured value with IS (ppt)
1023
1042
Measured value with ES (ppt)
930
945
1255
935
1495
985
Method Accuracy with IS (%)
98
103
Method Accuracy with ES (%)
92
91
120
89
144
99
Table 4: PFC concentrations (ppt) in human milk matrix A and spiked milk matrices B, C, and D. Note: The method accuracy was calculated with the formula
of 100 x measure value/(measure value of Matrix A + spiked value).
Figure 5: The separation and detection of the PFCs in human milk matries C