


 137 / 302

Results and Discussion
Separation of PFC Standards
A total of fifteen unique SRM transitions were monitored
for PFBS, PFHxS, PFHpA, PFDS, PFUnA and PFDoA, and
three were monitored for the internal standards m-PFHxS
and m-PFUnA (Table 1). Using the modified PFC-free LC-MS
platform, a mixture of the six PFC standards was separated
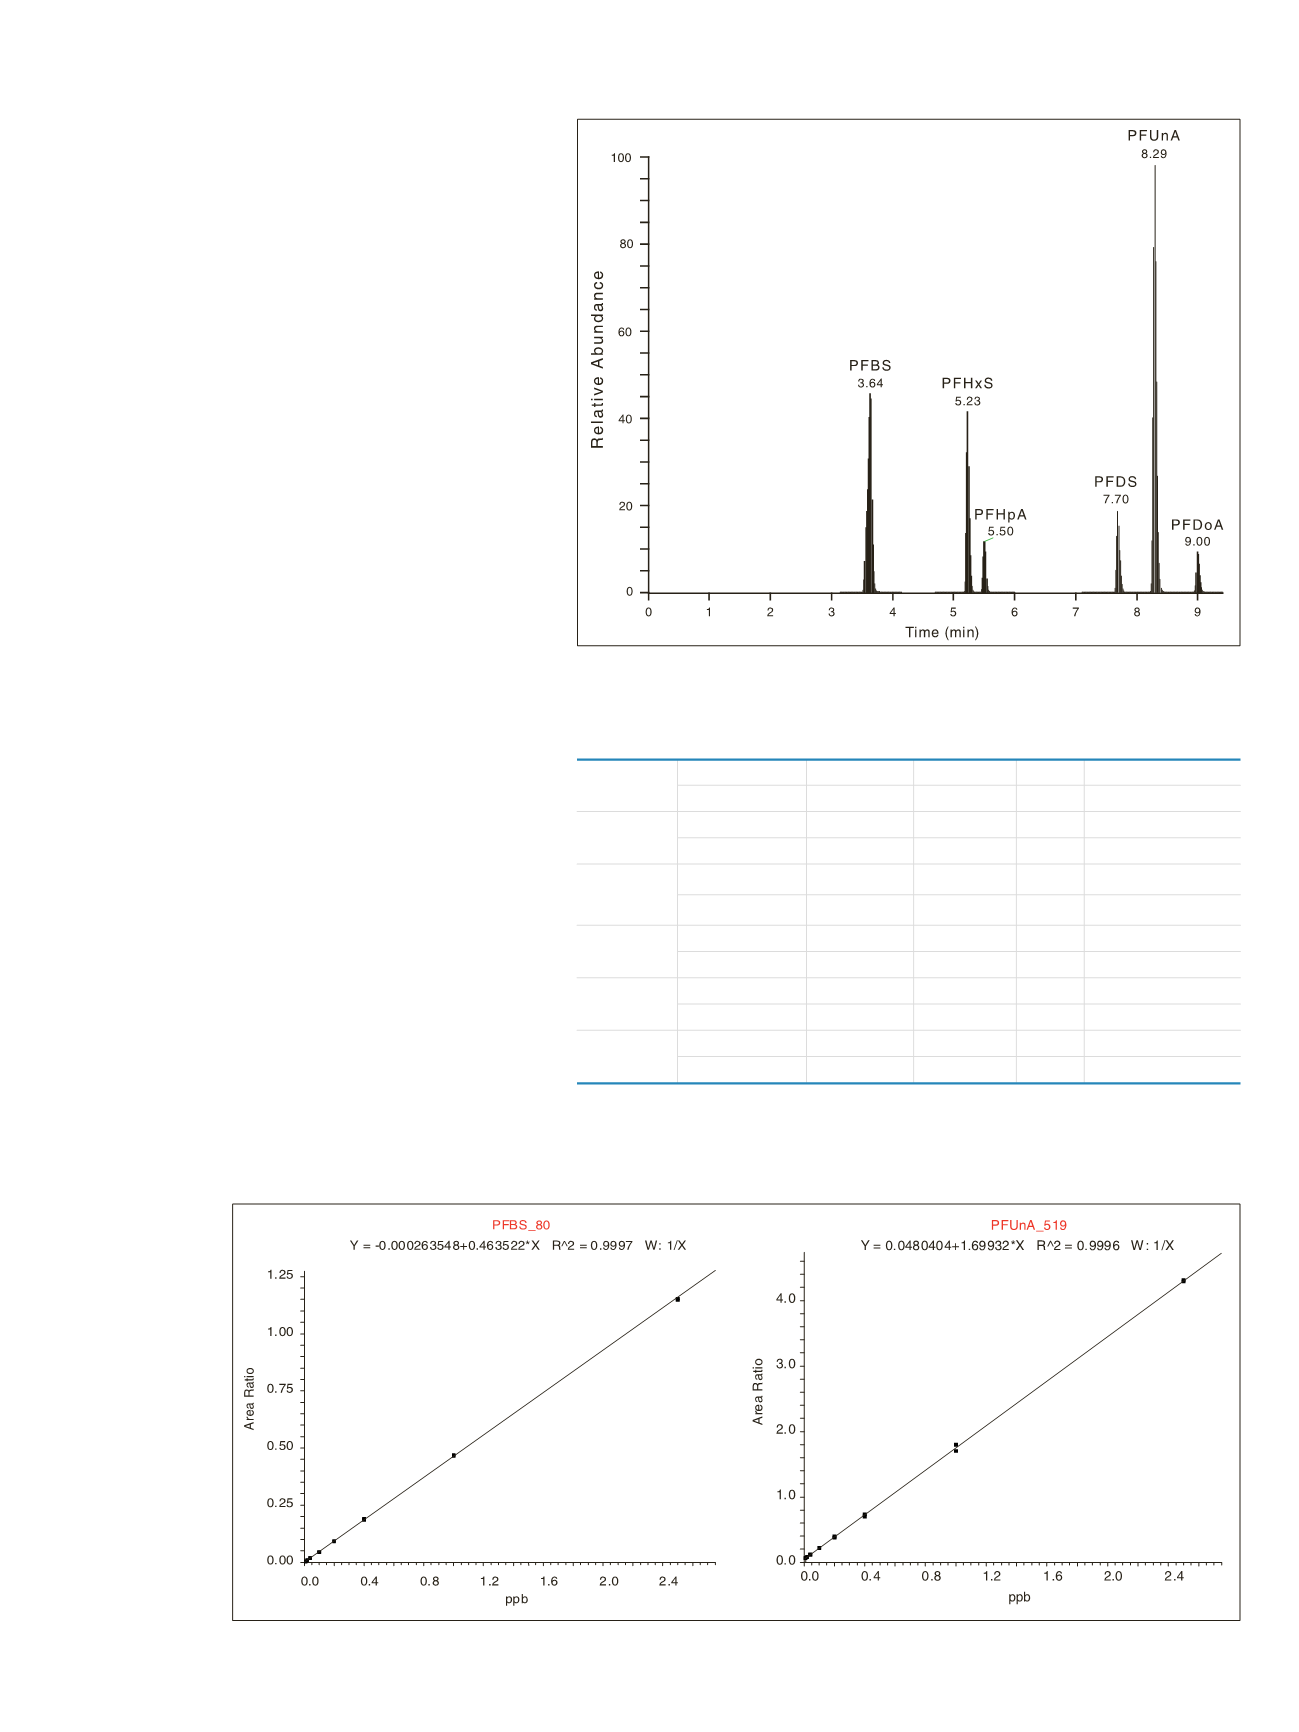
and detected under 10 minutes (Figure 1). All of the
compounds were baseline resolved with the elution order of
PFBS, PFHxS (m-PFHxS), PFHpA, PFDS, PFUnA (m-PFUnA)
and PFDoA. As the majority of interferences from matrices
elute early at void volume, elution of the first compound
at 3.64 min ensured a robust quantitation method.
Linearity and Sensitivity
Excellent linearity in detector response was observed over
the range of 0.04-2.5 ppb, with correlation coefficients
greater than 0.999 for all transitions. Representative
calibration curves for PFBS and PFUnA, obtained using
the internal standard method, are shown in Figure 2,
with coefficients of 0.9997 and 0.9996 respectively.
The sensitivity of the method is dependent on the
levels of interferences that are present in the blank and in
the solvents used. Limits of detection (LODs) and limits of
quantitation (LODs), defined as S/N ratio of 3 and 10,
respectively, are shown in Table 2. LODs ranged from
2–174 ppt, and LOQs ranged from 5–756 ppt. PFBS
and PFDS were detectable at 2 ppt and quantifiable at
5 ppt. Figure 3 shows the separation and detection of
10 ppt PFBS and 10 ppt PFDS at different SRM transitions,
and the corresponding blanks as comparisons. The higher
LOD and LOQ values observed for PFHpA, PFUnA and
PFDoA may be attributed to interferences present in the
blank and mobile phases.
Figure 1: Separation and detection of six PFC standards at 2.5 ppb concentrations.
Compounds SRM
LOD (ppt)
LOQ (ppt)
PFBS
298.9 > 80.2
2
5
SRM
298.9 > 99.2
5
12
SRM
PFHxS
398.9 > 80.2
21
83
SRM
398.9 > 99.2
12
66
SRM
PFHpA
362.9 > 169.0
174
756
SRM Blank Contamination
362.9 > 319.0
120
457
SRM Blank Contamination
PFDS
598.9 > 80.2
2
7
SRM
598.9 > 99.2
3
9
SRM
PFUnA
562.9 > 269.0
35
156
SRM
562.9 > 519.0
52
235
SRM
PFDoA
612.9 > 169.0
59
296
SRM
612.9 > 569.0
64
295
H-SRM
Table 2: LODs and LOQs of the PFC standards. LOQs were estimated from triplicate injections (CV < 15%)
of standard solutions at concentration levels corresponding to a signal-to-noise ratio of 10.
Figure 2: Representative calibration curves of PFBS and PFUnA standards.