


 133 / 302

Mass Spectrometry
MS analysis was carried out on an Exactive high perfor-
mance benchtop LC-MS with an electrospray ionization
(ESI) source in negative ion mode. Full scan data with a
resolution of 50,000 FWHM at
m/z
200-800 was acquired.
No lock mass was applied.
Results and Discussion
The high mass resolution (50,000 FWHM) and mass
accuracy (1 ppm) of the Exactive high-resolution, accu-
rate mass system provide efficient peak confirmation and
decrease the effects of matrix peaks (Figure 4). The concen-
tration of the target compound in the liver samples was
quantified by linear calibration. The use of lock masses
could enhance the mass accuracy; however, the Orbitrap
instrument was stable for the duration of the sample
analysis.
In Figure 5, the extracted ion chromatograms,
normalized to the response, are shown. The blank (a)
shows very little background and no significant signal at
the appropriate retention time. The 0.1 µg/kg standard (b)
has good signal for all compounds, as does the sample of
extracted Arctic seal liver (c).
For the calibration curves, three standards per level
(0.1, 1, 5, 10, and 50 µg/kg) were run. The calibration
curve for PFOA is shown in Figure 6.
The results of the analysis are displayed in Table 1. The
extracted liver from Antarctic seals showed significantly
lower concentrations of PFAAs than the extracted liver
from Arctic seals.
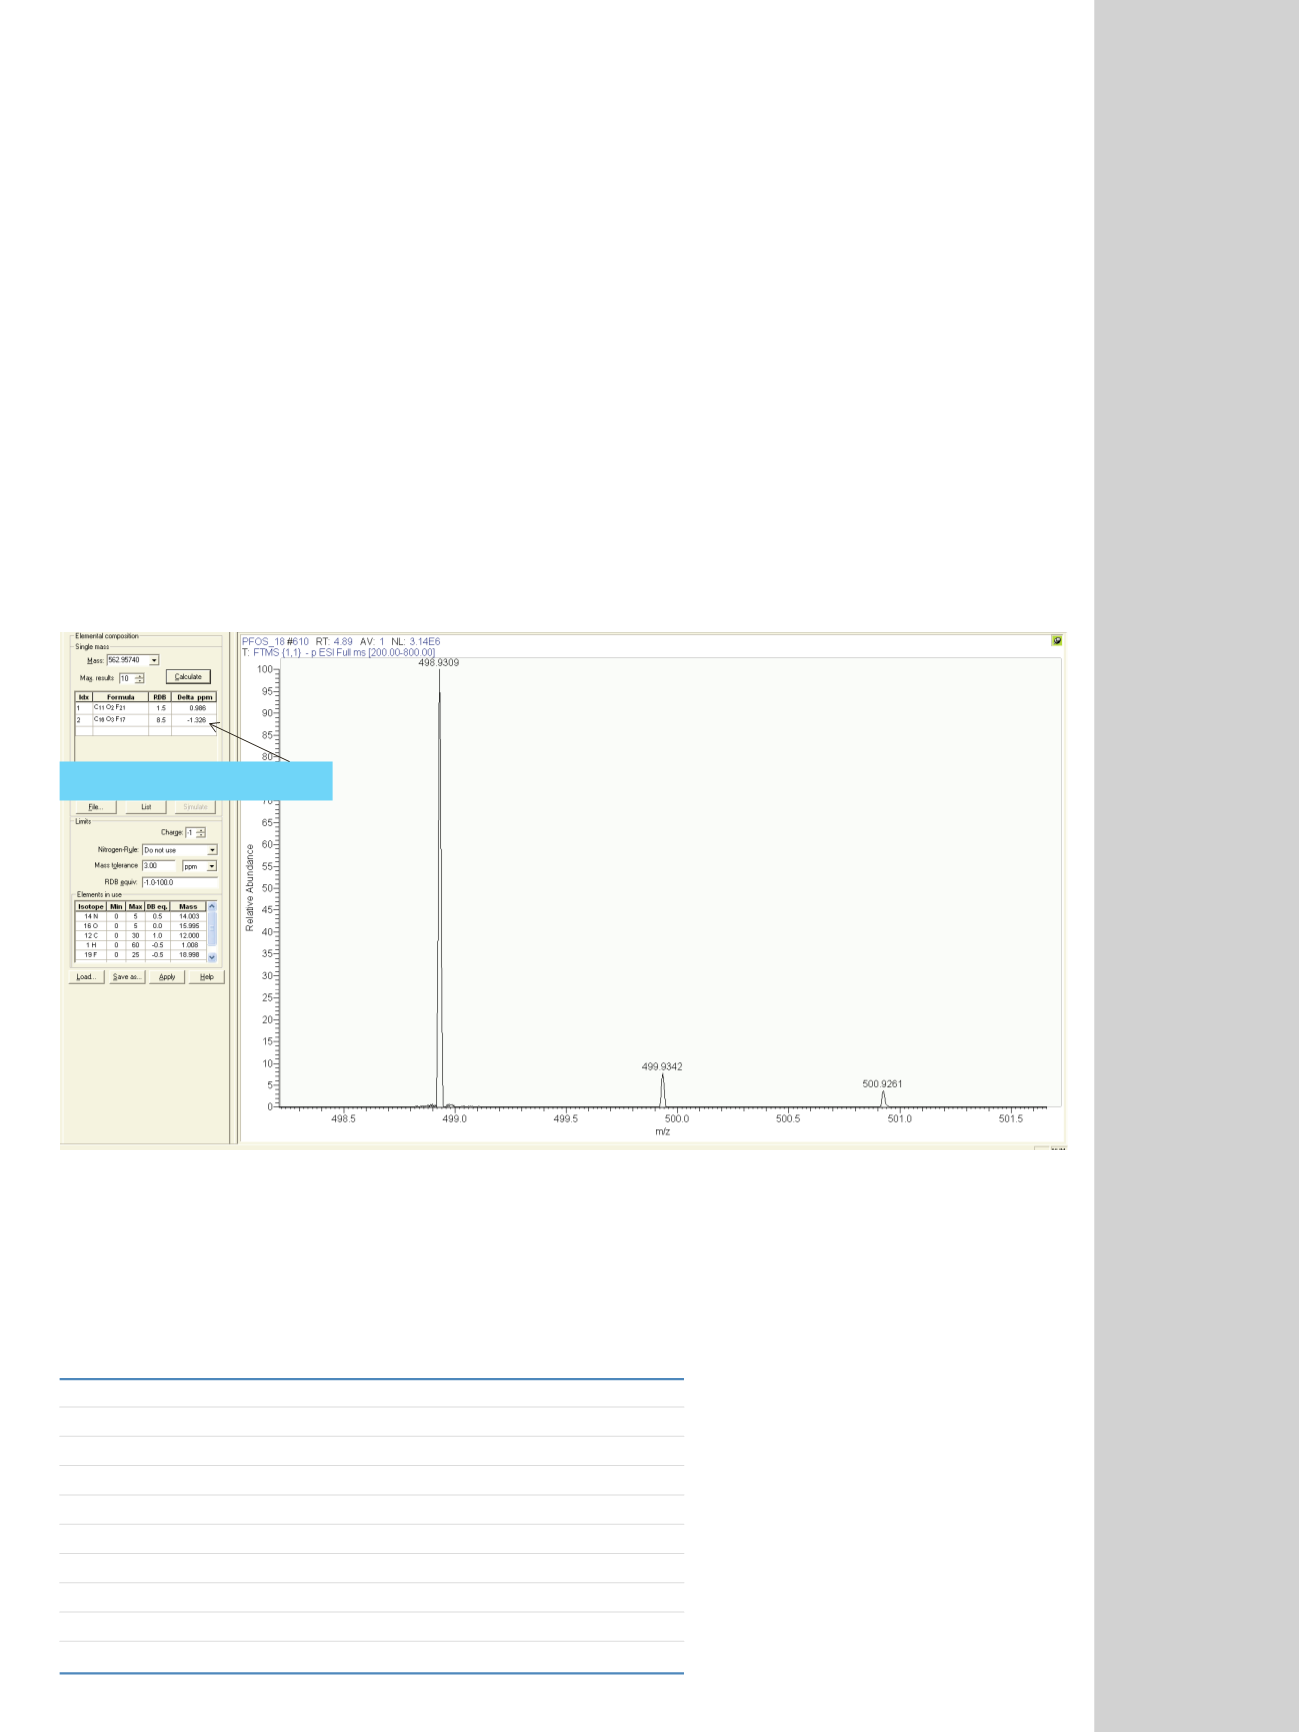
Mass Accuracy = 1.0 ppm
PFOS
m/z
498.9302 [M+H]
+
Full Scan Data
Figure 4. Mass accuracy of PFOS
Table 1. PFAAs in Antarctic and Arctic seal liver
Antarctic Seal
Arctic Seal
Arctic Seal
Arctic Seal
µg/kg
µg/kg
µg/kg
µg/kg
PFHpA
–
–
0.08
1.05
PFHxS
–
0.21
–
0.21
PFOA
0.25
0.35
2.28
4.37
PFNA
0.07
4.78
1.72
1.76
PFOS
–
22.95
17.79
2.28
PFDA
–
2.82
12.59
1.09
PFOSA
–
0.14
–
–
PFUnA
–
5.45
0.44
–
PFDoA
0.22
0.87
–
–
PFTrA
–
1.97
–
–