6
0.7 Da, there is already a remarkable resolution increase
by using the highly selective setting with 0.4 Da peak with
of the Thermo Scientific TSQ Quantum XLS. A significant
increase in mass resolution is observed when progressing
to the ultra selective mode with resolution settings of
≤
0.2 Da when using the TSQ Quantum XLS Ultra.
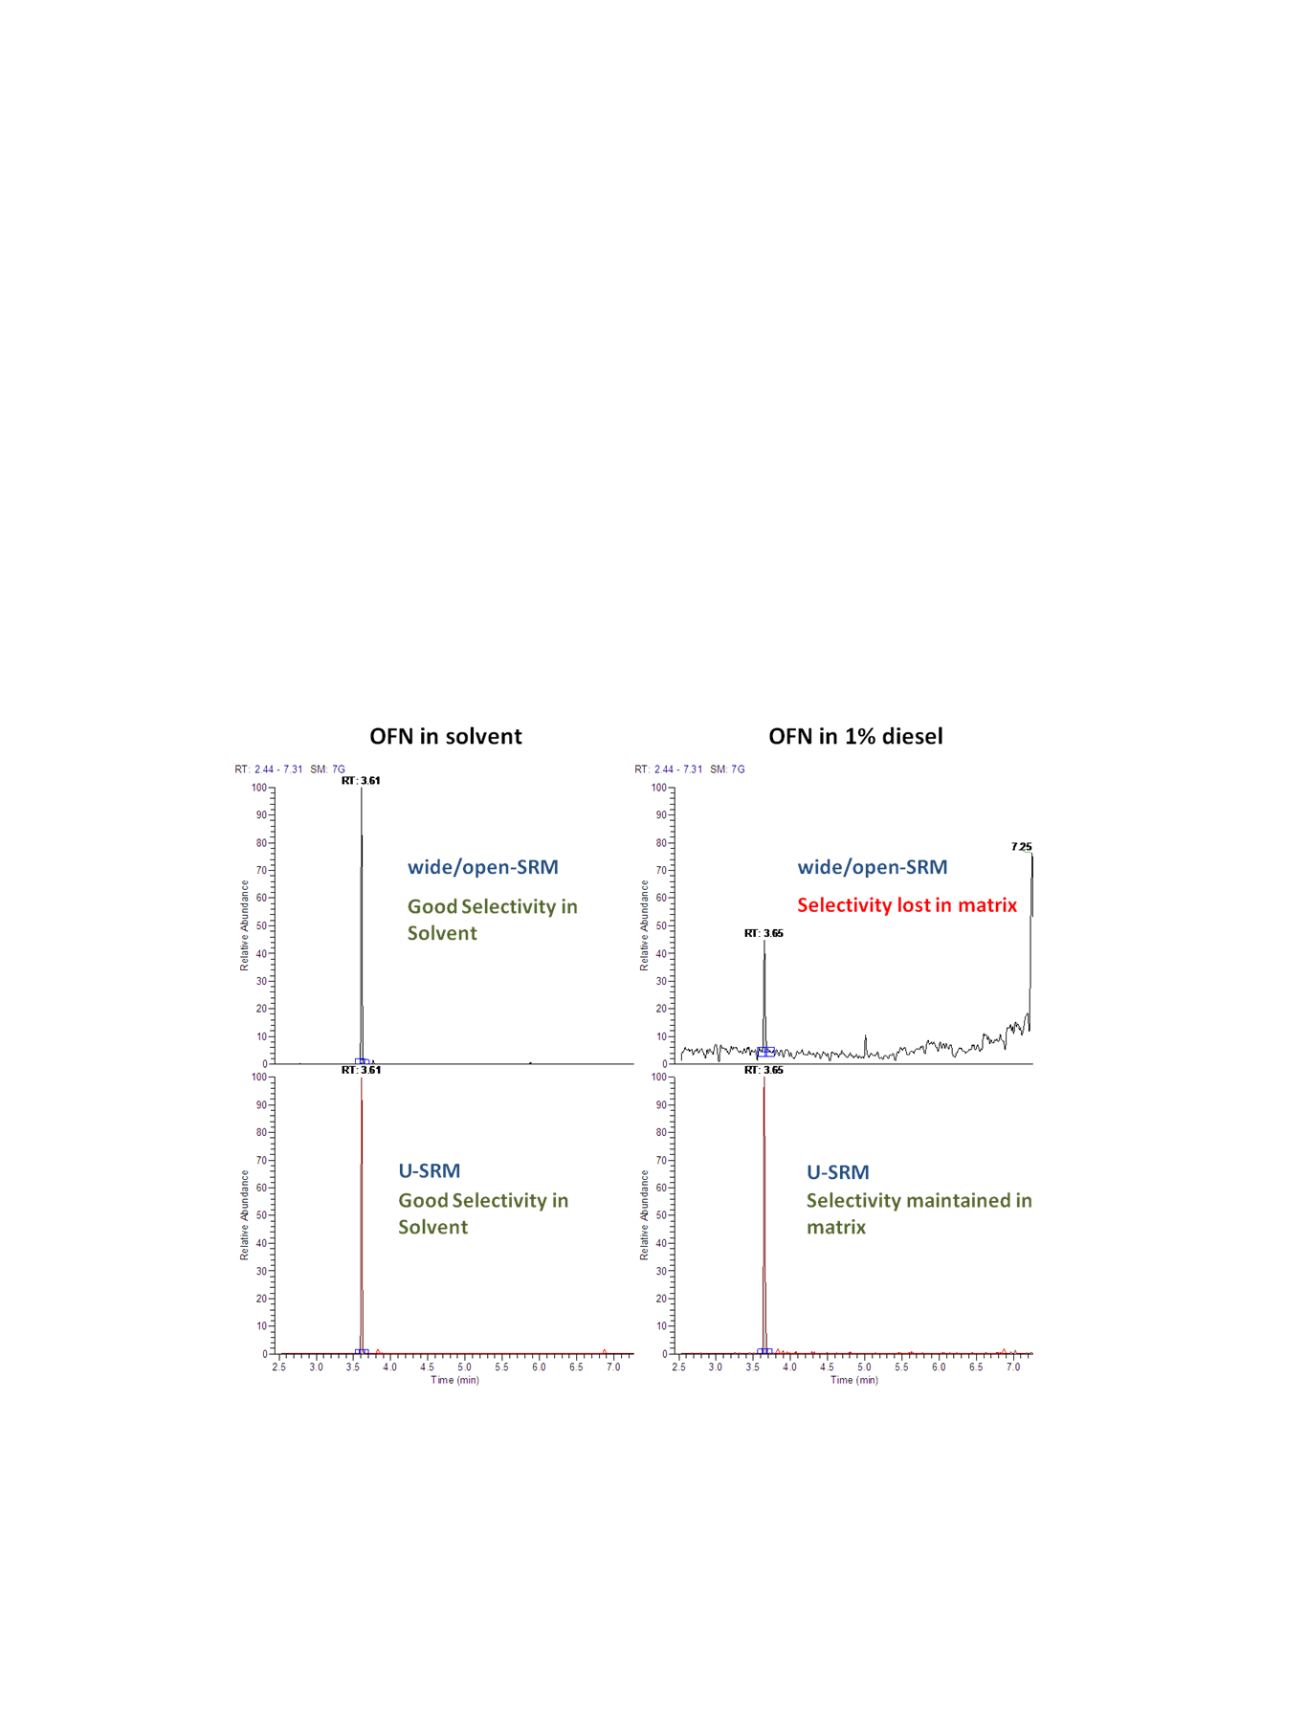
Figure 9 extends the earlier example from Figure 3,
octafluornapthalene in diesel, to compare the additional
selectivity power of U-SRM. As already discussed, the use
of increased resolution HyperQuads, operating in U-SRM
mode, allows the possibility to further eliminate interfer-
ence when moving to complex matrix. When compared to
modes of operation that utilize “wide” or “open” quad
resolution settings, it is clear that much higher confidence
when addressing matrix samples can be taken with high
sensitivity and high selectivity operation modes. In
addition to this, it reminds us that we should endeavor to
perform instrument evaluations in complex matrix
samples with normalized instrument resolution settings.
This allows both sensitivity and selectivity power to be
observed.
Conclusions
Selectivity is a critical evaluation parameter for a GC-MS/
MS system that is to face complex matrix samples. This is
a key parameter for instrumental evaluation criteria
alongside raw sensitivity and low-level precision
performance.
GC-MS/MS using enhanced mass resolution mitigates the
effect of surviving background interferences in SRM
experiments, especially in complex sample matrices. High
sensitivity, high selectivity analysis becomes possible, even
with reduced clean-up procedures or direct Thermo
Scientific Dionex ASE extracts for a large number of
target compounds in one run.
The analytical advantages of using U-SRM on the TSQ
Quantum XLS Ultra translate into increased productivity
for routine analysis by the increasing data quality and
increasing the possibility to save time with more generic
sample preparation approaches. Reliable automatic peak
integration becomes a regular feature of data analysis
which allows a much reduced manual invention and faster
time to result. This capability is particularly critical for
laboratories with high sample throughput.
Figure 9. 100 fg/µL OFN in solvent (left) and 1% diesel (right) under “wide/open” SRM conditions (top) and ultra
selective SRM mode (bottom)


