4
Exact Mass and Mass Defect
Common target compounds for pesticides, drugs, or
persistent organic pollutants (POPs) analyses typically
contain a high number of heteroatoms or halogens in their
structure. Typically hydrocarbon based or bio-organic
compounds are forming common background matrix
compounds. Examples of these include fuel oils, triglycer-
ides, humic/fulvic substances, waxes, lignin structures or
similar compound classes. In order to understand why
ultra-selective precursor isolation increases selectivity in
real applications when using U-SRM, it is necessary to
visit the concept of exact mass and mass defect.
Exact mass
is simply the calculation of the mass of a
compound to a greater degree of accuracy. This is
typically identifiable when masses are shown carry
multiple decimal places. When this is measured value on a
mass spectrometer, we refer to this as the accurate mass
within a specified tolerance.
A closer look at the elemental composition of common
target compounds detected in trace residue analysis
reveals that, relative to carbon (with its IUPAC defined
atomic weight of exact 12.00 g/mol), only hydrogen and
nitrogen show a significant positive shift of its exact mass
from the nominal mass of 1 g/mol and 14 g/mol respec-
tively (see Table 1). Because of the high hydrogen
occurrence in organic molecules, the apex of MS-detected
mass peaks of hydrocarbons shift significantly on the
accurate mass scale to higher masses. The calculated
“mass defect” (in this case positive), is commonly
expressed as a percentage of the deviation of the exact
mass from its nominal value normalized to 100 Da, is
typically in the range of 100 mDa/100Da for
hydrocarbons.
In contrast to hydrogen, most heteroatoms, predomi-
nantly halogens, sulfur, phosphorous and silicone shift the
mass peak of compounds containing these elements to
lower masses. This can be described as a “negative mass
defect.” This fine difference in exact mass is used by the
TSQ Quantum XLS Ultra to select target analytes during
ultra selective acquisitions whilst discriminating against
coeluting isobaric matrix ions. An example to illustrate
this effect can be made for the pesticide HCB at the
nominal mass
m/z
282, see Table 2. The HCB mass peak
is separated more than 0.5 Da on the mass scale from a
nominally isobaric hydrocarbon background compound.
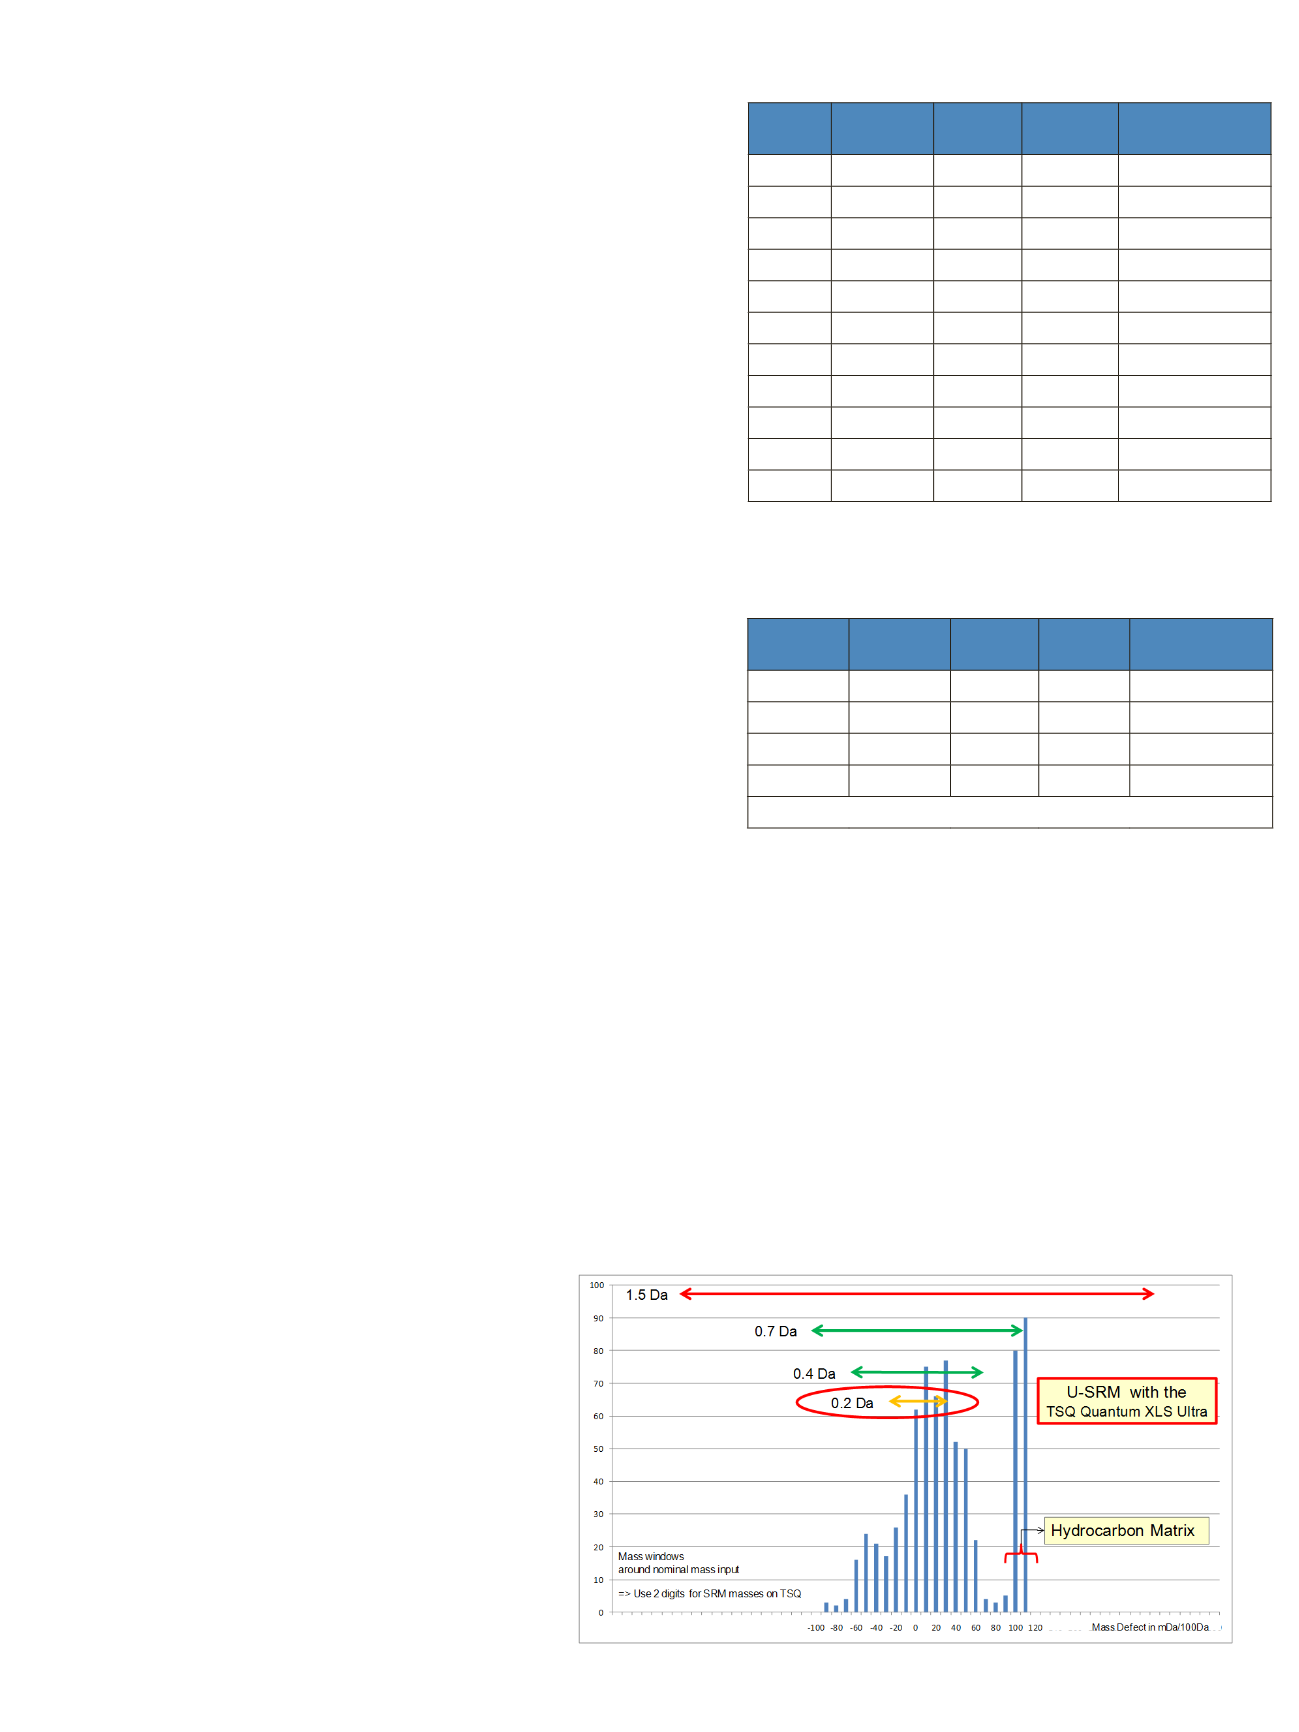
This mass difference can be exploited to cleanly separate
the HCB precursor ion in Q1 from the hydrocarbon
matrix on the TSQ Quantum XLS Ultra. This is a
relatively extreme example with a large delta mass.
Depending on analyte/matrix combinations encountered,
the resolving power of the quadrupole may need to exceed
5000+ resolution (FWHM). This is not usually available
on standard triple quadrupole instruments that do not
benefit from HyperQuad technology (see Figure 8).
Element
Nominal M
[Da]
Exact M
[Da]
Delta abs
[Da]
Rel. Mass Defect
[mDa/100Da]
C
12
12
0
0
H
1
1.0078
0.0078
783
N
14
14.0031
0.0031
22
O
16
15.9949 -0.0051
-32
O
16
15.9949 -0.0051
-32
S
32
31.9721
-0.0279
-87
Si
28
27.9769
-0.0231
-82
F
19
18.9984
-0.0016
-8
Cl
35
34.9689
-0.0311
-89
Br
79
78.9183
-0.0817
-103
I
127
126.9045 -0.0955
-75
Compound
Nominal M
[Da]
Exact M
[Da]
Delta abs
[Da]
Rel. Mass Defect
[mDa/100Da]
HCB
C
6
Cl
6
282
281.8134 -0.1866
-66
Alkane
C
20
H
42
282
282.3276
0.3276
116
Difference on mass scale 0.5142
Table 1: Mass defect of major elements in common analytes
Table 2: Example of the impact of the mass defect on the accurate
mass at nominal mass
m/z
282
Figure 5: 700 Pesticides sorted according to frequency of their relative mass defect


